It is a big time cliche, but a picture really is worth a 1000 words.
I can say that definitively, because when I put together these reviews of the past year or half year in supply chain, the graphics I use really do tell the story - wish I had room for more.
Gilmore Says.... |
 |
| Hope you enjoyed this review in numbers and charts. Anything else you would like to see? |
 |
What do you say? |
|
| Click here to send us your comments |
| |
|
|
|
Last week, I provided a month by month chronology of the top stories for the first six months if 2017, which you will find here: What Happened in Supply Chain in 1H 2017?
This week, I am back with a look at the 1H in what I call numbers and charts. So let's go.
In a bit of repeat from last week, the economic environment that has such a big impact on our supply chain was lukewarm in the 1H, as it has continually been since 2010 - the new normal.
Q1 US GDP growth was finally pegged at a weak 1.4%, with a slow start to the year yet again, repeating a recent pattern. The Q2 numbers when released are expected to be better, but not by much, maybe 2% real growth.
The IMF now forecasts annual US GDP to rise 2.1% in both 2017 and 2018, though the obvious trend in recent years is for the forecasts to be downgraded over time. The US amazingly has not seen 3% full year GDP growth since 2005, a longer stretch than has been seen for decades (I checked back to 1950) and maybe ever.
The IMF also predicts global trade growth of 3.5% for 2017, exactly equal to its forecast for global economic growth. Something has changed - until just a few years ago, global trade was gowing much faster than GDP for about two decades.This change is of course playing havoc on container shipping lines, leading to substantial consolidation.
eCommerce rolled on, up 14.7% in Q1, the last data point from the US Commerce Dept., and 14.2% in Q4 2016, as the growth rate stays 14-16% quarter after quarter, much, much faster than brick and mortar retail growth. Amazon changed its reporting again, and I can't find the usual data on its growth in "merchandine" sales, but "retail product" sales were up just 15% globally (not reported just in the US) in Q1, about equal to overall US ecommerce growth. However, revenue (commissions) from Amazon's Marketplace, where others sell goods on the Amazon platform, was up a very strong 34% in Q1.
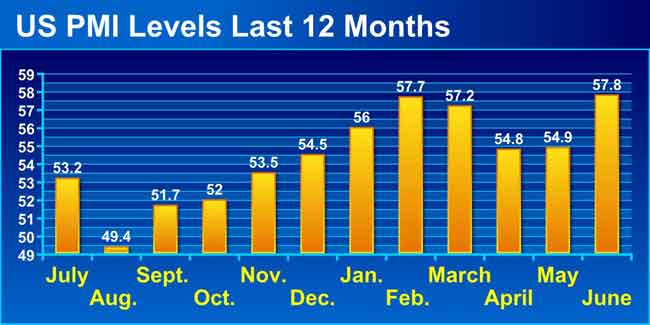
US manufacturing, once a bright spot early on in the pseudo-recovery after the Great Recession, gave mixed signals. The US Purchasing Managers Index from ISM was above the 50 mark that separates expansion from contraction in each month of the 1H, with June's 57.8 the highest level since August 2014.
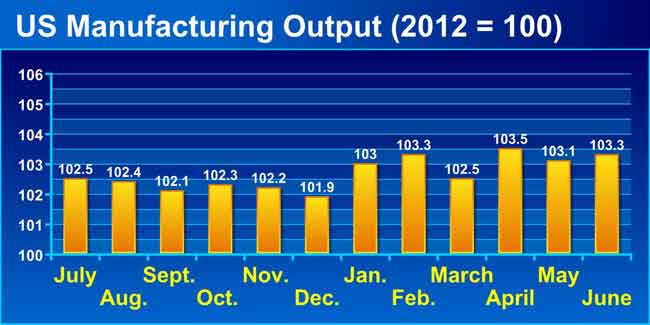
But, puzzingly, US manufacturing output numbers have been flat for a year, according to the Federal Reserve estimates, with the index numbers as shown in the chart below relative to the baseline year (index = 100) of 2012. As can be seen, there has been almost no increase thus far in 2017, and the scores around 103 mean just 3% growth in US output since 2012 - well less than 1% per year. Not good.
After rising sharply in the few months before the start of the year, US oil prices fell slowly but steadily for the rest of the 1H, dropping from $55.98 on Jan. 1 to a low of $41.56 in late June, ending the month at $46.33, for a drop of 17% thus far this year.
But despite that drop, diesel prices were largely flat, averaging $2.58 in January and just a bit lower, at $2.51, in June. By way of comparison, diel prices averaged around $4.00 per gallon from 2011-2014.
Those lower fuel costs and a generally weak freight environment made it generally good times for shippers. Data on volumes were mixed, as always seems the case. Through June, the American Trucking Associations' Freight Tonnage Index finds freight is up just 1% versus 2016. But the Cass Freight Index, measuring shipment activity, has been up each month through May, the last data point, saying "that a recovery in
freight had begun." Maybe.
The Cass Linehaul Index, which measures per mile US truckload rates before accessorials, fuel and other charges, did in fact show modest year-over-year growth in the last three months, after an incredible 13 straight months of y-o-y declimes before April.

From a long term perspective, at a June level of 123 versus the baseline level of 100 in January 2005, the Cass Linehaul Index is up an average of 1.74% over that period. Meawhile, the ATA Tonnage Index is up about 2% per year since 2000. So, it appears average rate increases have been modestly less than freight volume gains over the last 12-17 years.
Meanwhile, through May the Cass Intermodal pricing Index was up year-over-year each month thus far in 2017, making the streak nine months in total, after having fallen an incredible 21 consecutive months before that. Interrmodal volumes broke the 1H record set in 2015, and were up 2.7% versus 2016.
It was still largely good times for ocean shippers and importers. The China Containerized Freight Index was up about 12% from the beginning of the year through the end of June, but at a level of about 850 that is still well below the 1100 or so the index was at through most of 2014, before a big plunge in the second half of 2015 that has left rates lower ever since.
I have more but am out of space. Hope you enjoyed this review in numbers and charts. Anything else you would like to see? Combined with the timeline last week, it's a pretty thorough review of what we seen thus far in 2017.
Anything we missed? What do these trends tell you? Let us know your thoughts at the Feedback section below.
Your Comments/Feedback
|


