Wrapping up our review of the year in supply chain 2016, this week we offer our popular look at the past year in numbers and charts.
Last week, I summarized what I thought were the key supply chain themes and trends of 2016 (see Supply Chain Year in Review 2016: Top Trends and Themes). Then earlier this week, we published our excellent timeline of key news stories and events by month. Take a look - I guarantee you have forgotten a number of these important developments (see Timeline of Key Supply Chain News and Events by Month in 2016).
Gilmore Says.... |
 |
The Cass Linehaul Index was barely higher year over year in January and February, then went negative every month after that through Novembee. |
 |
What do you say? |
|
| Click here to send us your comments |
| |
|
|
|
So, let's get right to it.
It was yet another mixed/lukewarm year for the US economy. As it has for several years running, Q1 was a bust, with real US GDP up an anemic 0.8%, and then almost as bad in Q2 (1.4%). But then growth jumped to 3.5% in Q3. Q4 will come in fairly strong as well, according to most pundits, but full year growth is once again likely to be a little over 2%, as the US economy has amazingly not reached 3% growth since 2005.
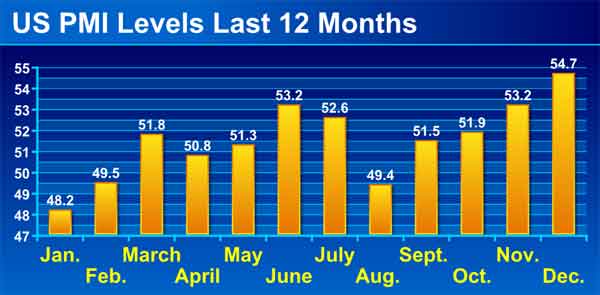
I would say the US Purchasing Managers Index from the Institute of Supply Management was fairly consistent with these numbers. As shown in the chart below, the PMI started by coming in just below the 50 mark that separates US manufacturing expansion from contraction in the first two months of the year (consistent with a weak Q1 GDP), then indicated expansion in nine of the next 10 months, ending the year in December on a 2016 high, with a decent score of 54.7.
However, the Q3 numbers from the PMI were not very strong and inconsistent with a robust 3.5% GDP growth rate, in my view, but who knows what's up.
From yet another view, US manufacturing was weak/flat for almost all of 2016, based on the monthly output numbers from the Federal Reserve. They were basically flat all year - no expansion, as seen in the interactive chart below.
More consequentially, as reported just about exclusively by SCDigest, the Federal Reserve in April made a major revision to its US manufacturing data. Among the changes, growth in US manufacturing output since 2013 is now estimated at only about 3%, half the 6% reported previously. That means, as can be seen in the chart above, US manufacturing output is still several percentage points below peak 2007 levels, now 10 years later. This is an under-reported fact.
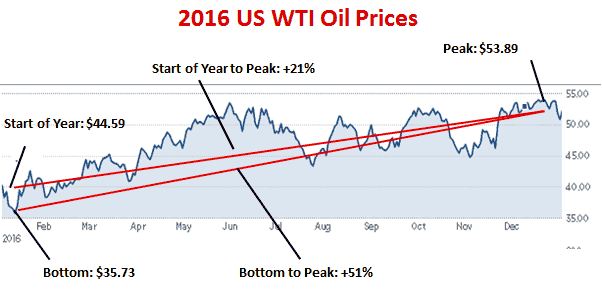
Oil prices had an interesting ride. As can seen in the chart below, WTI prices started the year about $44 per barrel, soon fell to 13-year-lows in February at about $36, rose until June, then stayed in a band of roughly $45-$55 for the rest of the year. Prices jumped to full year highs in late December after OPEC announced planned production cuts. The full year rise was about 21%, with some saying we will see $70 oil in 2016.
Naturally, US diesel costs roughly followed suit, starting the year at $2.21, falling to $1.98 in mid-February, then ending the year at a high for 2016 of $2.54, meaning the full year increase was about 15%.
All told, it was a good year for commodities, which as a group posted their first gain since prices started collapsing in 2011 after a multi-year run, as shown below (the index represents a basket of different commodity types).
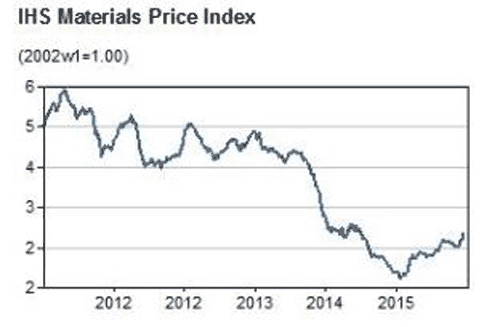
The Scotiabank commodity price index had metals/minerals up about 22% on the year, forest products up 9%, and oil/gas up 15%, though agricultural commodities were down 3.4%, causing reported grief for grocery chains and food manufacturers. The currently strong US dollar keeps a lid on commodity prices here, sends them higher in other countries.
There were mixed reports on freight volumes. In their quarterly earnings calls, rail, truckload and LTL carriers almost all characterized freight volumes as weak in each quarter in 2016. The Cass freight shipments index was down year over year every month in 2016 through November, with the exception of October. What's more, in almost every month in 2016 the index was below the levels in each of the years 2013, 2014 and 2015.
But the ATA's freight tonnage index was up 2.8% through November. It reached an all-time high in February of 144, meaning up freight volumes were up 44% versus baseline 2000 levels. But there were major swings up and down the whole year, with the index almost back to the record in November at 142.4. This is somewhat inconsistent with carrier reports and the Cass data.
Rates would indicate volumes were indeed weak.
For example, the Cass Linehaul Index, which tracks US per mile truckload rates, was barely higher year over year in January and February, then went negative every month after that through November, down in the 1-3.5% range each month. The average monthly rate change was -1.7% for the first 11 months of the year.

Rail volumes shrank again, with total units down a significant 8.2% for the year. according to the Association of American Railroads. Even once high flying intermodal car volumes were down 1.6% for the year. More telling, in October the Cass Intermodal price index rose modestly year over year after a surprising 22 consecutive months of price declines.
It was an ugly year for ocean container carriers, and another good one for shippers, as the China Containerized Freight Index started the year at about 750, down from 1200 in 2014, then fell to just 600 or so for most of Q2, at record low against the 1000 set as the baseline in 1998. The index rose to 800 or so by year's end, but the market is still ugly for carriers.
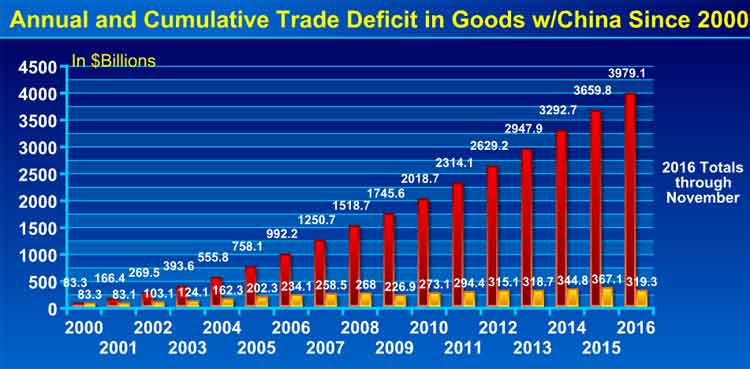
The US trade deficit continued along, coming in about $40-45 billion each month, though that's down from about $60 billion per month pre-recession. The trade deficit in goods with China also stayed strong, at about $319 billion through November, though the US will not as usual break the previous year's record level in 2016, which was the $367 billion deficit in 2015. The cumulative trade deficit with China since 2000 is about $3.6 trillion.
The growth of ecommerce sales in the US also rolled on, up 15.5%, 16.0%, and 15.7% in Q1 through Q3, respectively. Ecomerce represented 8.4% of total retail sales in Q3, by the government's calculation, but the way SCDigest figures it, the share is probably now over 10%. Total retail sales were up just 3% in 2016, so ecommerce is rapidly gaining share.
Amazon's is somehow growing even faster, with increases in merchandise sales of almost 30% in the US through Q3, and it will end the year with revenue of well more than $130 billion when it reports at the end of the month. For a change, Amazon actually made some profits in the year, $1.6 billion through Q3, but that was still just 2% of sales.
I have lots more but am out of space. Hope you enjoyed all this.
What is your reaction of supply chain 2016 in numbers and charts? What would you add? Let us know your thought at the Feedback section below.
Your Comments/Feedback
|


