SEARCH searchBY TOPIC
right_division Green SCM Distribution
Bookmark us
sitemap
SCDigest Logo

About the Author

Jeffrey Ivinski
Vice President of Product Management
INTTRA


He is responsible for INTTRA's product and channel strategies. Prior to joining INTTRA, Mr. Invinski was the Director of Business Process Management for Nippon Yusen Kaisha (NYK), where he established and implemented the business process and technology strategy for North America.  He also led product development, business process management, e-Commerce/EDI, and customs management.  Prior to NYK, Jeffrey was Senior Director of Sales Change Management at Maersk Line.  He started with Maersk Line as a North American trainee and held positions in refrigerated services, sales, pacific eastbound trade, and process and IT management. 

For more information, please visit www.inttra.com.


Supply Chain Comment

By Jeffrey Ivinski, Vice President of Product Management, INTTRA

January 12, 2012


Global On-Time Container Delivery Analysis

Choosing an Ocean Carrier Based on Performance Measurements


Only 47% of containers booked in the past year were delivered in a timely manner.

38% of all late deliveries are not directly related to vessel schedules.

(Source:  OceanMetrics)

OceanMetrics has the ability to match a carrier’s original booking confirmation against the status indication that the container is ready for pick-up by the shipper. This information allows an accurate measurement of the on-time reliability of container deliveries. As the measurement is tied directly to the actual delivery of the container itself, it automatically includes any delays incurred irrespective of vessel schedules and routing. This makes the OceanMetrics measurement unique.

The total number of TEU moved globally is subject to quite some uncertainty, however OceanMetrics’ data captures 20-30% of all containers moved globally. Using the OceanMetrics database to analyze global on-time container delivery therefore provides a solid view of the status of the industry.

Ivinski Says:

start
Just as some shippers want very high reliability for time sensitive products for example, others might be perfectly content with a low on time delivery performance.
close
What Do You Say?
Click Here to Send Us Your Comments
feedback
Click Here to See Reader Feedback

Methodology

Every single container delivery is matched against the corresponding booking confirmation, when both of these are available in INTTRA’s OceanMetrics platform. This data is combined into a weekly measurement of on-time delivery reliability. Additionally, in order to eliminate statistical fluctuations in the data, the data is always calculated as an average over the past 13 weeks.

OceanMetrics provides this data for the past 52 weeks, wherein each week’s total data then contain the arrival of approximately 3 million TEU.
The Results

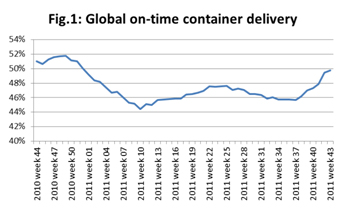
The first result is a simple calculation of the global on-time delivery development. Figure 1 illustrates this development, and it is seen that the global average over the past year has been 47% on-time delivery of containers, albeit with some significant fluctuations over the year. A high-point is reached towards the end of 2010 with 52% of all containers being delivered on time. Then there is a decline to a low point in week 10 in 2011 where only 44% of all containers were delivered on time. The latest data indicates that in the past 13 weeks, 50% of all containers were delivered on time.


Comparison to schedule reliability

OceanMetrics data indicates that containers were delivered on-time in 50% of the cases over the past 13 weeks. How does this compare to carrier performance and how much of this is due to carrier reliability?

Using the carriers within the OceanMetrics data as the baseline, the adjusted global carriers’ average schedule reliability is 69% in Q3 2011 according to SeaIntel Maritime Analysis*. If we look purely at vessel on-time arrival, 31 out of 100 containers would have been delivered late. However, based on OceanMetrics data, we know that 50 containers are delivered late. Therefore, an additional 19 containers are late because of non-vessel operations.

Based on this, we can deduce that schedule reliability accounts for 62% of the delayed containers, whereas other factors account for as much as 38% of the late containers. This indicates that a significant portion of the delayed deliveries are unrelated to the vessel operations.

 
  • 62% (31 out of 50) containers are late due to vessel operations
  • 38% (19 out of 50) containers are late for other non-vessel operations

    *SeaIntel Maritime Analysis global carriers’ average schedule reliability is 65% for Q3 2011.

Differences Across Carriers

The data tells us that the differences are very large across the individual carriers. Figure 3 illustrates the highest and lowest on-time delivery statistics over the past 52 weeks. The lines in figure 3 do not represent any single carrier, but simply the on-time delivery statistics for the highest or lowest performing carrier that particular week.

This data clearly shows that shippers have a wide range of service levels to choose from in the market. Just as some shippers want very high reliability for time sensitive products for example, others might be perfectly content with a low on time delivery performance.  What is important is that the shipper not only realizes that the product differentiation is as large as it is, but also that he is able to quantify and measure the difference as part of his decision to choose a particular carrier.


INTTRA, a global provider of e-commerce solutions for the ocean freight industry, launched OceanMetrics in November 2011.  This new performance measurement platform provides actionable service delivery information – booking cycle and on-time delivery - based on actual carrier and shipper transactions processed on the INTTRA e-commerce platform. 


Recent Feedback


No Feedback on this article yet


.