Focus on Productivity is Different
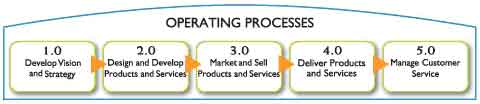
APQCs Supply Chain process and metrics model sits within its overall Operations framework, a five-step model:
- Develop Vision and Strategy
- Design and Develop Products and Services
- Market and Sell Products and Services
- Deliver Products and Services
- Manage Customer Service
Deliver Products and Services is the primary Supply Chain related component of the overall model.
One thing that sets the APQC model apart is its focus on productivity metrics per full time equivalent (FTE) or dollar spent; for example, “Number of FTEs for the logistics function per $1 billion revenue,” under transportation and warehousing. That theme is carried through most of the supply chain process categories.
Of course, no one model is going to be perfect for a specific company, and its easy to get in trouble by taking them too far. For example, focusing on the FTE-related metrics might drive a company to incorrectly outsource some supply chain processes.
The APQC metrics framework is certainly a valuable addition to the existing knowledge base.
The metrics framework by category is detailed below.
Supply Chain Planning
- Cash-to-cash cycle time
- COGS as a percentage of revenue
- Finished goods inventory turn rate
- Forecast accuracy one planning period prior to production run
- Number of FTEs for the supply chain planning function per $1 billion revenue
- Production schedule attainment for a planning period
- Total annual inventory turn rate
- Total expediting costs to execute the production plan
Procurement and Sourcing
Sourcing Strategy:
- Number of FTEs for the process “develop sourcing strategies” per $1 billion purchases
- Personnel cost (including benefits) of the process “develop sourcing strategies” per $1,000 purchases
- Total cost of the process “develop sourcing strategies” per $1,000 purchases
Select suppliers and develop/maintain contracts:
- Number of FTEs for the process “select suppliers and develop/maintain contracts” per $1 billion purchases
- Percentage of annual purchases value from certified vendors
- Personnel cost (including benefits) of the process “select suppliers and develop/maintain contracts” per $1,000 purchases
- Total cost of the process “select suppliers and develop/maintain contracts” per $1,000 purchases
Order materials and services:
- Cycle time in hours to place a purchase order
- Number of FTEs for the process “order materials/services” per $1 billion purchases
- Number of purchase orders processed per “order materials/services” FTE
- Percentage of purchase orders approved electronically
- Personnel cost (including benefits) of the process “order materials/services” per $1,000 purchases
- Total cost of the process “order materials/services” per purchase order
Appraise and develop suppliers:
- Number of FTEs for the process “appraise and develop suppliers” per $1 billion purchases
- Percentage of supplier orders delivered on time
- Personnel cost (including benefits) of the process “appraise and develop suppliers” per $1,000 purchases
- Total cost of the process “appraise and develop suppliers” per $1,000 purchases
- Total number of active vendors in the master file per $1 million purchases
Produce/Manufacture Product
- Actual production rate as a percentage of the maximum capable production rate
- Annual work-in-process (WIP) inventory turn rate
- Finished product, first pass quality yield
- Labor turnover rate as a percentage of work force
- Manufacturing cycle time in hours
- Percentage of defective parts per million
- Scrap and rework costs as a percent of sales
- Standard customer lead time (order entry to shipment) in days
- Unplanned machine downtime as a percent of scheduled run time
- Warranty costs (repair and replacement) as a percent of sales
- Unplanned machine downtime as a percent of scheduled run time
Deliver Product Service to Customer
- Annual contact center cost as a percentage of total annual revenue
- Annual products accepted for return as a percentage of total revenue
- Average cycle time in days between physical receipt of returned product to shipping of replacement for end-customer mail-in returns (not in-person returns)
- Obsolescence rate of spare parts and products in inventory
- Percentage of field service and depot repair incidents outsourced
- Percentage of part numbers on backorder
- Percentage of product support incidents (or “cases”) opened by the support center that are remotely resolved
- Percentage of repair incidents identified as “no fault found”
- Percentage of support requests that go through a pre-authorization (entitlement) process
- Percentage of total units returned for reasons other than product damage or failure
- Percentage of units returned from both end-customers and retailers/distributors
- Value of contracts sold for extended warranties or other services as a percentage of revenue
- Warranty costs associated with in-warranty field service, maintenance, and depot repair as a percentage of total annual revenue
Manage Transportation and Warehousing
Define logistics strategy:
- Customer order cycle time in days
- Number of FTEs for the process “define logistics strategy” per $1 billion revenue
- Personnel cost (including benefits) of the process “define logistics strategy” per $1,000 revenue
- Total cost of the process “define logistics strategy” per $1,000 revenue
Plan inbound material flow:
- Number of FTEs for the process “plan inbound material flow” per $1 billion revenue
- Personnel cost (including benefits) of the process “plan inbound material flow” per $1,000 revenue
- Return processing cycle time in days
- Total cost of the process “plan inbound material flow” per $1,000 revenue
Operate warehousing:
- Dock-to-stock cycle time for supplier deliveries, in hours
- Finished goods inventory turn rate
- Number of FTEs for the process “operate warehousing” per $1 billion revenue
- Order fill rate
- Order line fill rate
- Percentage of sales order line items not fulfilled due to stockouts
- Personnel cost (including benefits) of the process “operate warehousing” per $1,000 revenue
- Pick-to-ship cycle time for customer orders, in hours
- Rate of annual raw material inventory turns
- Total cost of the process “operate warehousing” per $1,000 revenue
Operate outbound transportation:
- Number of FTEs for the process “operate outbound transportation” per $1 billion revenue
- Percentage of full-load trailer/container capacity utilized per shipment
- Percentage of orders expedited
- Personnel cost (including benefits) of the process “operate outbound transportation” per $1,000 revenue
- Total cost of the process “operate outbound transportation” per $1,000 revenue
Manage returns; manage reverse logistics:
- Number of FTEs for the process “manage returns” per $1 billion revenue
- Percentage of annual sales value that is returned
- Personnel cost (including benefits) of the process “manage returns” per $1,000 revenue
- Total cost of the process “manage returns” per $1,000 revenue
The full framework is available from the APQC web site at no charge.
Do you agree or disagree? Share your perspective by emailing us at feedback@scdigest.com |


