One thing we have learned here at SDiges is that any number from any source must be taken with a large grain of salt, especially with regards to what is actually behind a given figure.
Take for example, the reports from the Census Bureau on the balance of US trade. As we reported earlier this week, the US trade deficit with the rest of the world in "goods" for all of 2015 was a whopping $758.9 billion.
But what is included as a "good?"
Well, the high level number includes anything that isn't classified as a service. So that means it also includes oil. The US government, however, does recognize it would be nice to understand trade balances afer subtracting out oil, and it does provide that data, though you have to look fairly hard for it on a historical basis.
Turns out that excluding oil, the US trade deficit in goods was $653.3 billion last year, with the oil deficit itself at about $83 billion (there are some adjutments that don't make the two numbers quite add up). That's a lot, but much lower than most years recently, as growing US production and falling global prices reduced the volume and value of US oil imports. In 2010, for example, the oil trade imbalance was $265 billion.
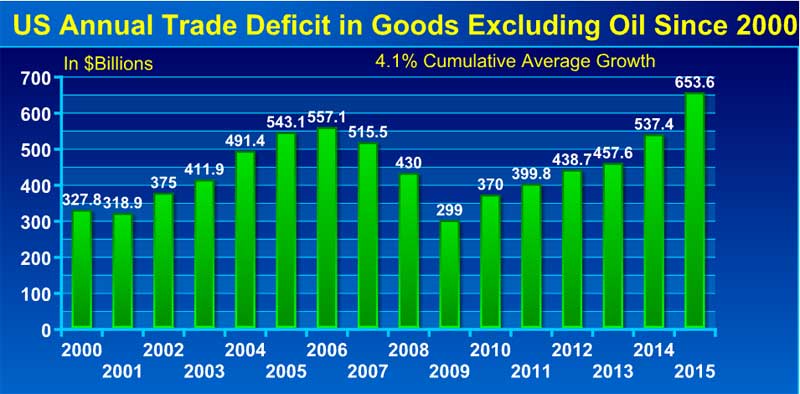
That's interesting to know, so now let's chart the trade deficit in goods excluding oil, which you will find below annually from 2000 though 2015. As can be seen, that deficit has risen from $327.8 billion in the first year of the range to the $653.3 billion level for 2015 mentioned above.
Source: Supply Chain Digest, from US Government Sources
It is interesting to see the significant drop in this "goods excluding oil" deficit around the recession years of 2008 and 2009, before the climb starts again.
Despite that big two-year slump, the average cumulative growth rate from 2000 through 2015 has been a very strong 4.1%. Since 2011, that growth rate has surged to 13.0% annually.
The US has it appears lost none of its appetite for imported goods, even as the thirst for oil is down.
Any Feedback on our Supply Chain Graphic of the Week? Let us know your thoughts at the Feedback section below.
|


