We've seen a very similar version of it before, but we enjoyed a presentation from Dr. Paul Dittmann from the University of Tennessee on supply chain transformation and strategy at the MHI (formerly the Material Handling Institute) annual conference in Ponte Vedra Beach, FL.
Dittman authored the book Supply Chain Transformation in 2012, and he used that as a basic guide for his excellent presentation.
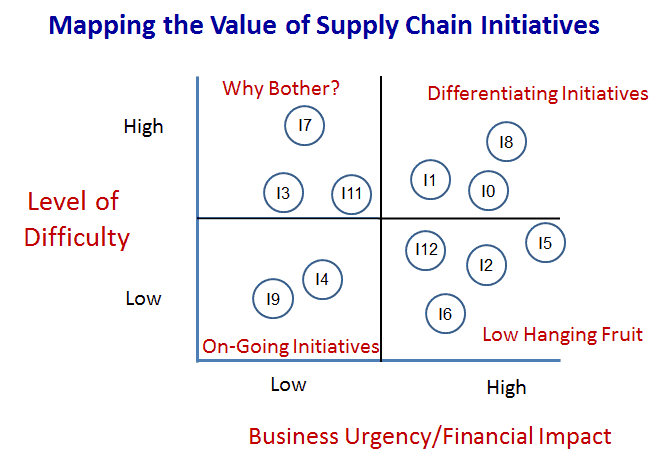
But we believe the graphic below, created by SCDigest from a slide Dittmann presented at MHI, is not from the book. It illustrates what Dittmann said was an approach one company he was working with use to get a handle on a number of supply chain initiatives they had started or were considering.
The approach uses a standard two-dimensional model: the company placed each initiative (I1, I2, etc.) on a grid, with the X-axis representing the urgency or financial impact of each project, and the Y-axis the level of difficulty in getting the initiative complete (cost, effort, risk, etc.).
Developed from Material from Paul Dittman, University of Tennessee
The result is as usual a four-box map. Projects that are high impact and easy to do Dittmann characterized as "low hanging fruit." High impact and high difficulty projects - obviously generally involving some if not substantial risk - are often ones that if successfully completed can result in meaningful competitive differentiation.
Low impact and low difficulty projects often involve on-going and continuous improvement type initiatives, while those that are low impact and high difficulty, well why bother? (Dittmann actually used a slightly different term for that quadrant.)
So, this is a simple way to visualize what is going on in terms of effort and priority for current or potential supply chain iniatives. It seems to us that a given company would want a balanced portfolio of projects in the bottom two and upper right quandrants at any one time. And are you toiling away on any initiatives in the upper left quadrant?
Any Feedback on our Supply Chain Graphic of the Week? Let us know your thoughts at the Feedback section below.
|


