The Texas A&M Transportation Institute is back with a fresh version of its Urban Mobility Scorecard report for 2015, which measures the level and impact of traffic congestion across US metro markets.
The headline news is that in the last couple of years, US urban traffic congestion has once again reached levels seen prior to the recession, while total costs of that congestion continue to rise - and is going to get worse.
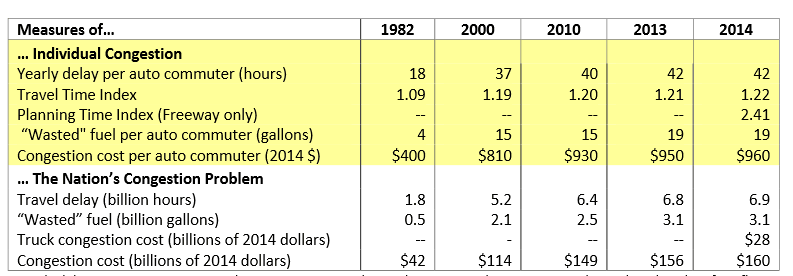
The table below shows summary findings from the research, based on 2014 data. As can be seen, drivers in the top 471 metro markets on average spent 42 hours in congestion in each of the last two years, levels last seen in 2008, an increase largely related to the slow but steady increase in US employment levels.
The Institute's Travel Time Index, which measues the ratio of travel time in the peak period to travel time at free-flow conditions, also continues to rise, to 1.22 in 2014, up about 15% versus 1982.
Major Findings of the 2015 Urban Mobility Scorecard (471 U.S. Urban Areas)
Source: Texas A&M Transportation Institute
Of course, the situation in many markets is much worse than the overall average, impacting both car drivers and freight moving through or into urban areas. While the average time spent in congestion is 42 hours per year across the top 471 markets, it's almost double that in the Washington DC area, at 82 hours per year, and is 80 hours annually in Los Angeles.
The San Francisco, New York City/Northern New Jersey, and Boston metro area round out the top five for most heavily congested roads.
The report also found that while severe and extreme congestion levels affected only 1 in 9 trips in 1982, it was encountered in 1 in 4 trips in 2014.
The 2015 report notes, however, that "Congestion is worse in areas of every size - it is not just a big city problem. The growing delays also hit residents of smaller cities. Big towns and small cities have congestion problems - every economy is different and smaller regions often count on good mobility as a quality-of-life aspect that allows them to compete with larger, more economically diverse regions."
It adds that "As the national economy improves, it is important to develop the consensus on action steps - major projects, programs and funding efforts take 10 to 15 years to develop."
It's going to get worse. The report says that before the economic recession, congestion was increasing at between 2 and 4% every year, and we are now back on that trajectory. It further predicts that total time spent in traffic will increase from 6.9 billion hours in 2014 to a whopping 8.3 billion hours in 2020.
"Damn, that traffic jam," as James Taylor once sang.
Any Feedback on our Supply Chain Graphic of the Week? Let us know your thoughts at the Feedback section below.
|


