As usual in June, BP released its annual Statistical Review of World Energy, a sort of almanac of all things energy related, one of our favorite reports here at SCDigest every year.
You can find our full summary of the report here: BP Releases Its Statistical Review of World Energy for 2015.
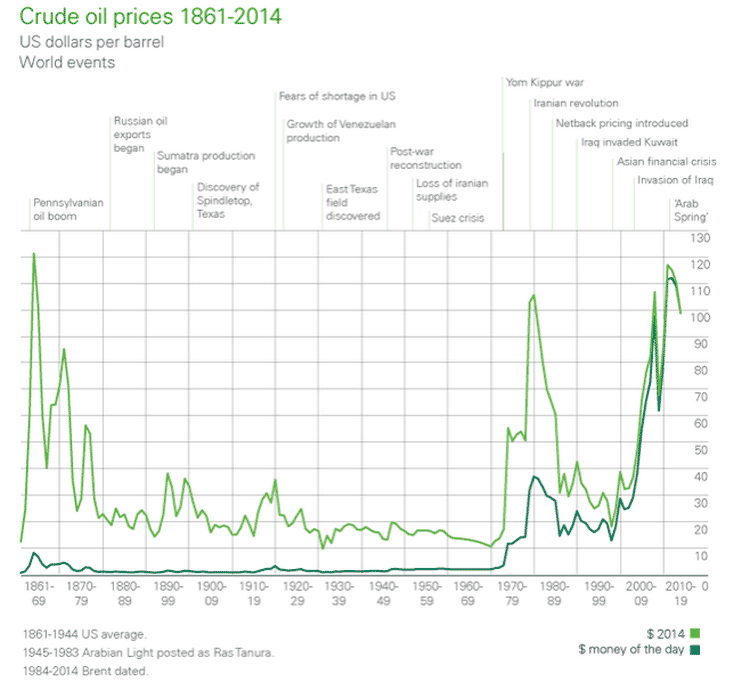
Not in that summary but once again in the report is an interesting chart that looks at oil prices historically, both in the dollars of the day (blue line) and then in constant 2014 dollars (green line). Both chart the price for Brent Crude at least since 1984, sort of the global price for oil per barrel, versus the US benchmark of West Texas crude, which tends to run $5-10 lower per barrel than Brent for reasons that are never quite explained.

Source: BP
We see a few interesting observations:
• Other than the very early years, the high mark in prices in constant dollars was in the late 1970s amidst turmoil in the Miiddle East, before that high was exceeded first in the average for 2008 and then again over the past few years.
• Despite the collapse of oil prices in the second half of 2014, the full year Brent average was still $98.95, down marginally from the $107.66 seen in 2013. However, that was the first annual average below $100 since 2010.
• Right now, Brent is running about $64 dollars per barrel, though that is up from the low so far in 2015 of around $54 per barrel in January.
• In the late 1990s, oil prices in constant dollars fell to just $20 or so per barrel.
Where do we go from here? While most experts seem to expect some small rises in oil prices in coming months, virtually no one is predicting a rise to anything near $100 per barrel for the foreseeable future, as US production from fracking has utterly changed the supply equation, with America becoming the largest producer of oil in 2014, according to BP, overtaking Saudi Arabia.
The US has increased its production of oil by more than 1 million barrels per day for three straight years, BP notes, the first time in history any coutnry has done that.
Any Feedback on our Supply Chain Graphic of the Week? Let us know your thoughts at the Feedback section below.
|