Amazon.com came out with its Q4 and full year earnings late last week, and for a change, Amazon reported a profit, with an operating income of $591 million in Q4, compared to an operating loss of $544 million last quarter. However, for the year there was a net loss of $241 million.
Revenue in Q4 was $29.33, with a growth rate of 15% year over year, down
from the 20-21% rate the company has seen in recent quarters.
Revenue for the full year was $88.99 billion, up 20% over 2013.
Amazon put quite a bit of detail into its reporting, including supply chain items such as fulfillment costs, shipping costs, inventory turns and more.
Ah that it were that simple.
The Amazon numbers are very hard to parse from a supply chain perspective, for several reasons. That includes the fact "merchandise sales" includes goods Amazon sells and fulfills itself, some it sells and which are fulfilled by the vendor, some that are sold by vendors and fulfilled by Amazon, and its "marketplace" business, where the products are sold on the Amazon site by vendors and then fulfilled by them.
Why does this matter? Because while Amazon breaks out a number of supply chain costs, such as shipping costs and fulfillment costs, those really can only be understood in terms of some ratio, such as percent of sales.
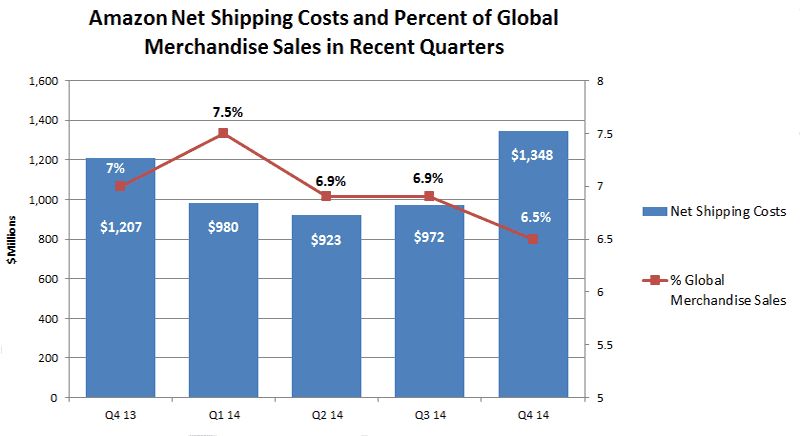
Case in point: Amazon reported its shipping costs as a percent of global sales over the last five quarters. The company continues to lose money on shipping, with the net costs in Q4, for example, of $1.3 billion - meaning that is the delta between what it took in from customers for shipping (including Amazon Prime) versus what it spent on shipping.
The Amazon figures report shipping costs as a percent of worldwide sales - and over the last five quarters, that was in the 4-5% range.
But that includes sales of media and web services and things that do not require shipping. So while it's not perfect due to the complexities described above, comparing those costs against only global merchandise sales would at least provide a better perspective.
Using that denominator, shipping costs are more in the 6-7% of sales range - quite a meaningful difference, as shown below.

Heck, we remember when companies used to actually make money on shipping.
Any Feedback on our Supply Chain Graphic of the Week? Let us know your thoughts at the Feedback section below.
|