We're not quite sure who first said "Demography is destiny," but it sure captures a powerful truism.
While the statement was really meant to reflect a social reality, you could say it is just as relevant for the supply chain as it is for the broader social landscape, as in the end the supply chain has to be where the people are, and support the demand that different types of people will require of the supply chain ecosystem.
So we were very interested this week in some interactive charts as part of an article in USA Today on growing racial and ethnic diversity in the US. In fact, the paper said the US is currently in what it is calling a 'second great wave" of immigration, after the first such wave that ran between 1880 and 1920 and brought millions of European immigrants to US shores.
This second wave involves immigrants from all over the world, but of course epsecially from Mexico and other areas of Latin America.
USA Today recently developed a "diversity index," which caculates for each county in the US how likely the next person you meet would be of a different race/ethnicity than you are. So, a score of 50 indicates there is basically a 50-50 chance the next person will different.
As a country as a whole, USA Today puts the current index at 55, based on Census Bureau date. It says that by 2060, that index score will rise to 70. That means there will be less than a 1-in-3 chance that the next person
you meet then will share your race or ethnicity, whatever it is: white,
black, American Indian, Asian, Native Hawaiian or Hispanic.
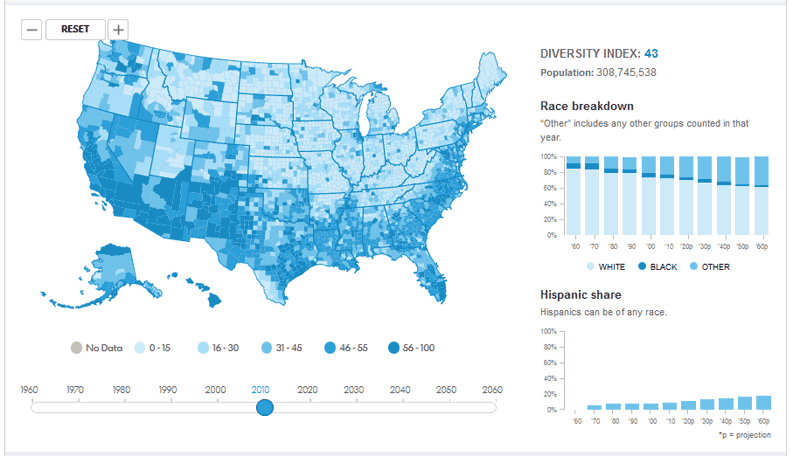
The interactive tool allows you to look at the whole country by county at different 10 year periods. Here is a static shot of the US in 2010.
2010 US Diversity by County

Source: USA Today
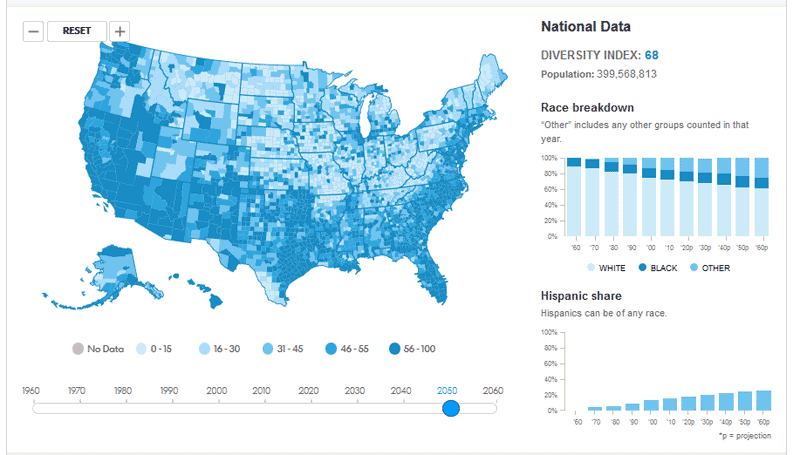
Here is how the picture changes by 2050 (we used 2050 rather than the last year available, 2060, as that just seemed too far off).
2050 US Diversity by County

The level of diversity clearly goes way up in the period, based on USA Today estimates, getting over the index level of 55 in much of the country, with a notable increase in diversity in many areas of the Midwest.
What's it all mean for supply chain? More challenges, really, as in general diverse populations have more diverse needs and habits. That says to us SKU counts are headed still higher, in more geographies.
The full article and interactive tool can be found here: Second immigration wave lifts diversity to record high
Any Feedback on our Supply Chain Graphic of the Week? Let us know your thoughts at the Feedback section below.
|