| |
|
|
|
| |
|
|
|
 |
|
|
|
| |
|
|
|
| |
|
- Sept. 26, 2014 - |
|
| |
|
|
|
| |
|
| |
|
| |
|
| |
|
As always, the annual "3PL Study" was released in a presentation session at the CSCMP conference in San Antonio later this week, under the leadership once again of Dr. John Langley of Penn State.
We will review the entire report on the pages of SCDiget in the next couple of weeks, but will note here that like many others the 3PL report team decided to use some of the popular "infographic" style for this year's report. That includes the graphic below, which nicely summarizes many of the key data points from this year's resuilts:
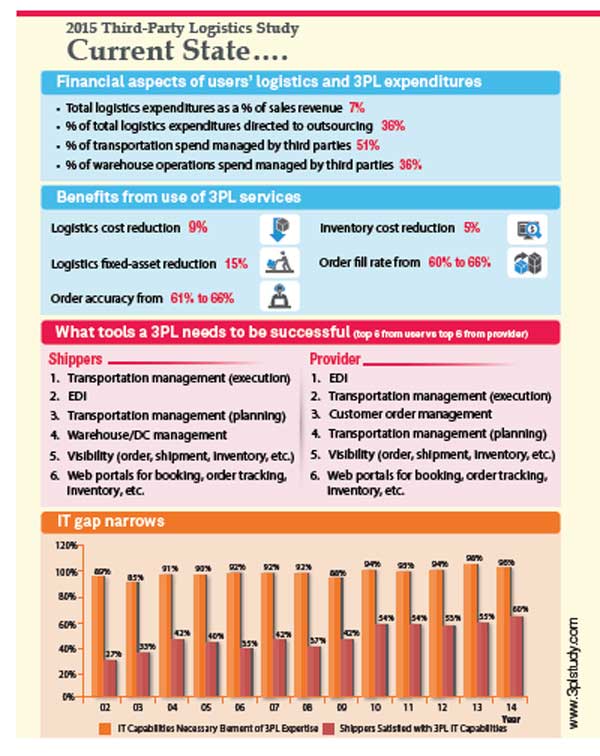
Source: Annual 3PL Study
We'll just let that graphic speak for itself awaiting our more detailed review, but the continued reduction in the so-called "IT Gap" - the level of satisfaction shippers have with 3PL technology capabilities - certainly deserves a shout out. 60% of shippers are now satisfied with 3PL IT capabilities, up from just 42% as recently as 2009.
More soon.
Any Feedback on our Supply Chain Graphic of the Week? Let us know your thoughts at the Feedback section below.
|
|
| |
|
| |
|
|
|
|
| |
|
|
Recent Feedback |
|
No Feedback on this article yet
|
|
| |


