| |
|
| |
|
 |
Supply
Chain by the Numbers |
| |
|
| |
- August 22, 2014 -
|
| |
|
| |
|
| |
|
| |
Needed - More Women Supply Chain Execs; Rail Profits are Really on Track; At Long Last, US Manufacturing has Made it Back; Truckload Rates Headed in the Wrong Direction for Shippers |
| |
|
| |
| |
| |
|
100.7
|
|
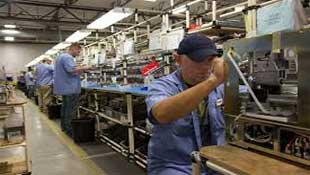
The level of US manufacturing output in July, according to Federal Reserve data released last Friday, meaning that at long last US manufacturing volumes have surpassed the peak and baseline year (index score = 100) of 2007. While it is possible that the score could be revised down next month, the .7 percent cushion means it is very unlikely to go all the way back below the 100 mark. The measure has gone up in an almost straight diagonal line from the bottom in June 2009, when it fell to just 80.3, meaning production was down almost 20% from 2007 levels, the worst score ever recorded. But the slow pace of the recovery means it has taken some seven years to get back to where we were pre-recession.
|
| |
| |
|
| |
| |
7.2% |
|
Increase in over the road per mile US truckload rates in July versus 2013, as prices continue to rise very rapidly, which SCDigest predicted early this year. The July rise follows increases of 6%, 5.7%, 5.8% and 5.2% in March through June, respectively. What is happening? Put simply, freight volumes are rising, while truckload carriers are at best keeping capacity flat if not fractionally down in some cases. Part of that asset discipline is strategic, but increasingly the issue is a lack of drivers to fill tractor seats. In the end, it's the basic law of supply and demand, which is now heavily in the carrier's favor. Forecasts generally are that this upward rate pressure will continue for the rest of the year - not good news for shippers.
|
| |
| |
|
|
|
| |
|
 |
| |
|
|
| |

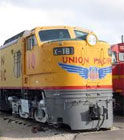 The incredible operating ratio that rail carrier Union Pacific was able to achieve in Q2, according to its recent earnings release. The operating ratio equals operating expense divided by operating revenue, a key metric in the transport sector. That outstanding performance - a record for the company - led UP to achieve net income as a percent of revenue of an equally impressive 22.8%. By comparison, Procter & Gamble had net income of 13.5% of revenue in the quarter. In fact, the other three public Class I US rail carriers are had operating ratios under 70%, with Norfolk Southern droppings its OR level to 66.5% from 70.1% in 2013, in what was a profit blow out quarter for the rail carriers. You can find all the details here: