This week, a chart that is admittedly only loosely directly connected to the supply chain, but we think worth including as our graphic of the week nonetheless.
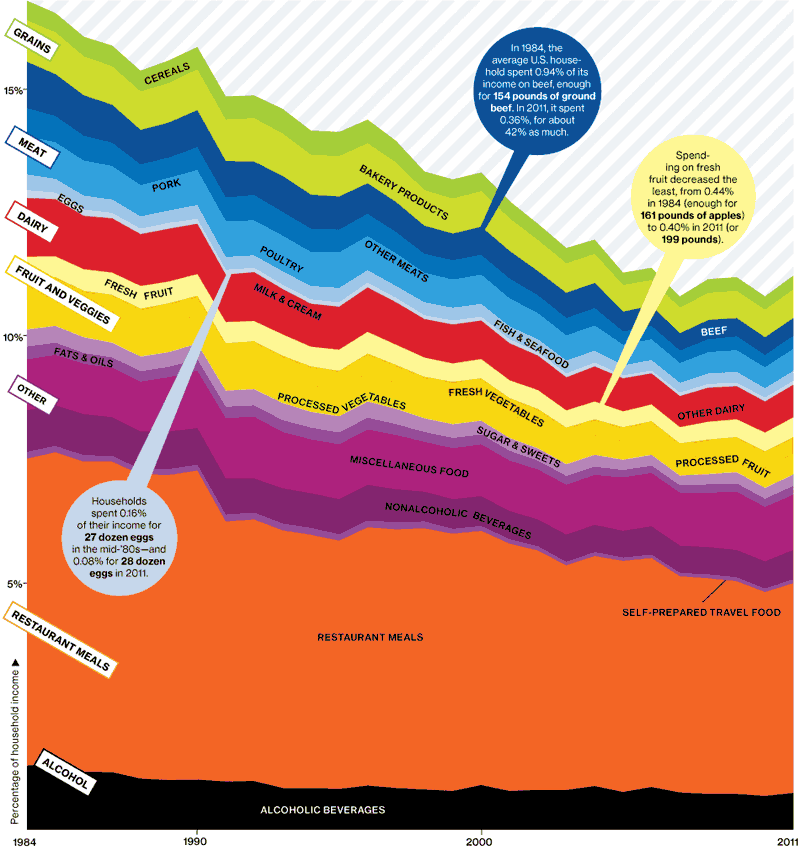
In late Febuary, Bloomberg BusinessWeek had an article that included this graphic, on the percent of US aftertax consumer income that was spent on food from 1984 to 2011, based on US Bureau of Labor Statistics data.
Very surprising to us, given the perception of "food inflation," that percentage continues to decline in general, though there has been a small rise in the last few years after the sort of end to the Great Recession.
As BusinessWeek notes, "In 1984, the average U.S. household spent 16.8 percent of its annual
post-tax income on food. By 2011, Americans spent only 11.2 percent. The
U.S. devotes less of its income to food than any other country - half as
much as households in France and one-fourth of those in India."
As an aside, Some observers have suggested that massive food inflation was the root cause of the recent "Arab Spring" uprisings.
US Consumer Food Costs as Percent of After Tax Income 1984-2011

Source: Bloomberg BusinessWeek
We have to think that US food supply chain efficiency is a huge contributing factor in this long term decline in the expense ratio.
SCDigest editor Dan Gilmore is somewhat dubious of the decline in restaurant meal costs as percent of income, given the trends in his household, but the data is the data.
Any Feedback on our Supply Chain Graphic of the Week? Let us know your thoughts at the Feedback button below.
|