It is the 50th anniversary of the opening of the first Walmart store in Rogers, Arkansas this month, and last week SCDigest editor Dan Gilmore wrote his First Thoughts column on "50 Years of Walmart's Supply Chain," pondering on the impact the world's largest retailer has had on its suppliers' supply chain practices, its growing share of the US and global retail market, the many Walmart supply chain initiatives that have affected the industry, and more.
So we are going to revisit Walmart's first fifty years one more time, but here with graphics and charts. The first charts two were used by Gilmore last week, the rest are new here. Together, we think they will help you really understand the company much better.
The first shows sales at each of Walmart's main three business units (US stores, Sam's Club, and International) from 2001 to 2011 (actually Walmart's 2012 fiscal year ending in January). In 2011, Walmart had
global sales of $444 billion, a number almost hard to imagine. Of that,
$318 billion was domestic US (combining US store sales and Sam's Club),
and $126 billion was international. Notice the cumulative average growth rates over that time: US stores
6.62%; Sam's Club 6.23%; international 13.5%; and total company 8.08%.
We next looked at Walmart's US retail market share. We did that in a way we don't believe has been done before. To calculate the best comparable number, we took total US retail sales as reported monthly from the US Census
Bureau, then subtracted from that total each year sales of
automobiles, auto parts, gasoline stations and restaurants. This then
gives us a better look at the markets in which Walmart more legitimately
competes (yes, we know Walmart sells some gasoline and does a bit of
in-store restaurant business, but don't believe these aren't material to the
analysis).
We then calculated Walmart's US retail market share by combining US store
and Sam's sales and dividing that by the size of the overall US retail
market (from our definition.) And what results is a pretty powerful and
important story, as shown in the chart below. US market share has grown
from 10% in 2001 to 13.8% in 2011, after having topped 14% in the
preceding two years.
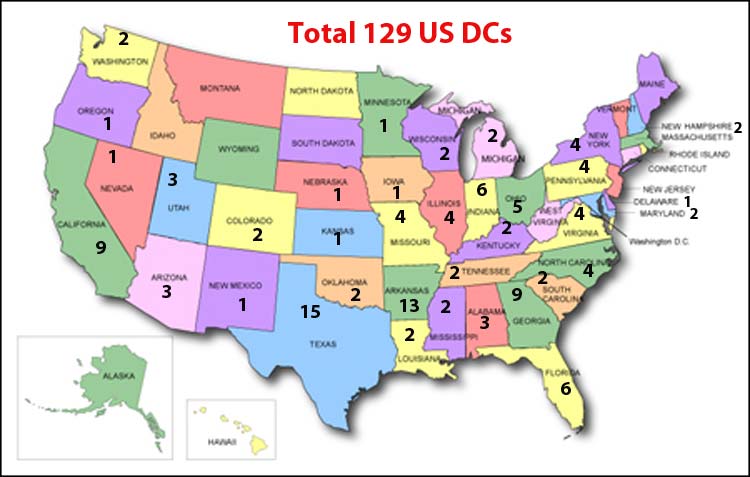
How large and complex is Walmart's US distribution network? Plenty. The graphic below shows its US DCA network by state, including general merchandise, grocery and any other formats, 129 facilities in total. This is based on the best available information we can find - it's possible we are behind on one or two more recent ones.
Walmart US Distribution Network by State
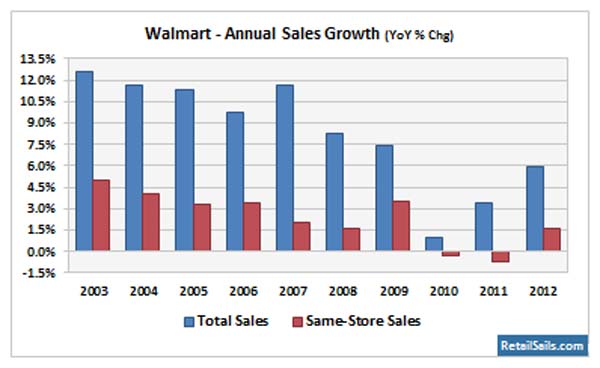
We next post some charts from the web site RetailSails.com. The first takes a different look at Walmart's sales numbers. Here you see annual growth in overall sales dollars, and its change in same store sales since 2003 (actually 2002). As can be seen, in general both those numbers have been trending down in percentage terms, with Walmart seeing a long streak of declining same store sales numbers in recent years before more recently turning that around. In fact, the better "comps" of late are a key factor in the recent strong run up in Walmart's stock price after years of flat performance.
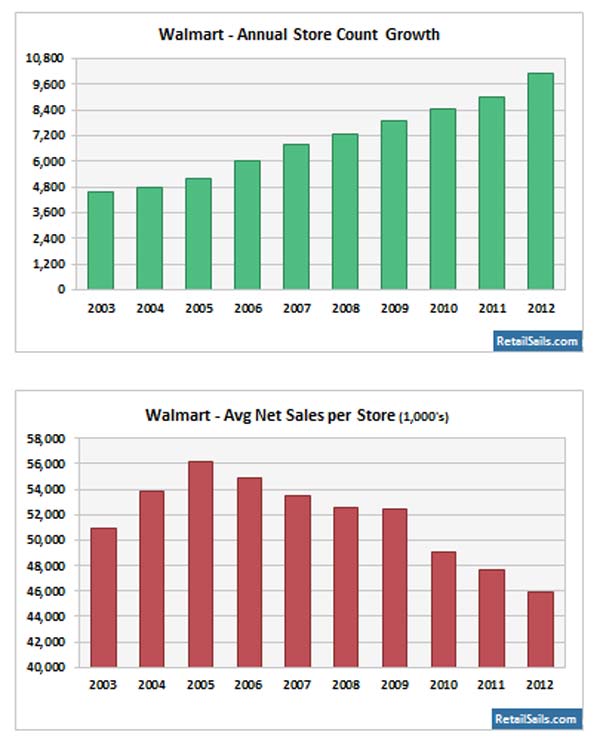
Next, RetailSails provides some data on Walmart growth in its number of stores, combining both US and global outlets. As can be seen, store growth has strong, putting the chain at about 10,000 stores currently (4400 in the US, 5600 outside the US).
Below that, you will find the average sales dollars per store. As can be seen, that number has been declining since 2005. A small part of that would have been lower sales per store in the US, coming largely from some cannibalization of US stores from existing stores, but the primary factor is surely the growth in international stores which in many markets have lower sales per unit.
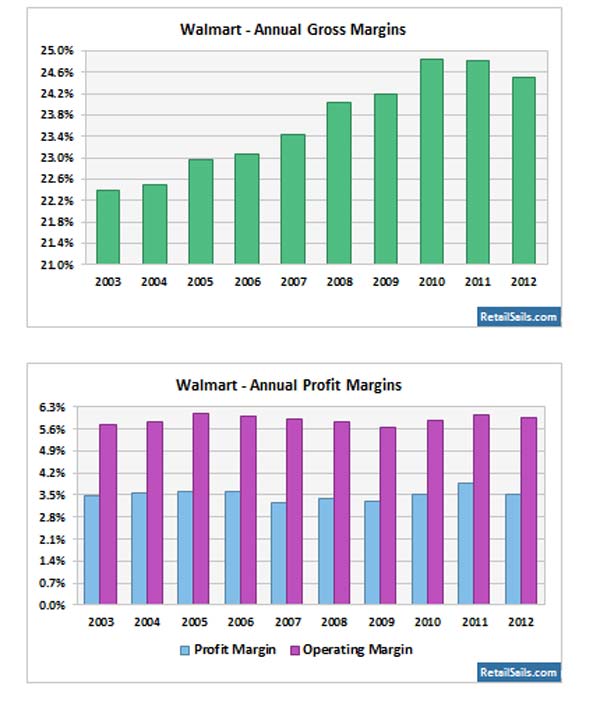
In general, Walmart profit margins have remained strong, with gross margins (roughly equal to cost of goods sold divided by sales) rising from 22.4% in 2003 to 24.5% last year. Note gross margins did take a dip in 2011 (fiscal 2012), as Walmart lowered prices to try to get US sales moving again, apparently with some success.
Walmart's overall and operating profits, interestingly, have remained very steady since 2003, unusual in the retail industry.
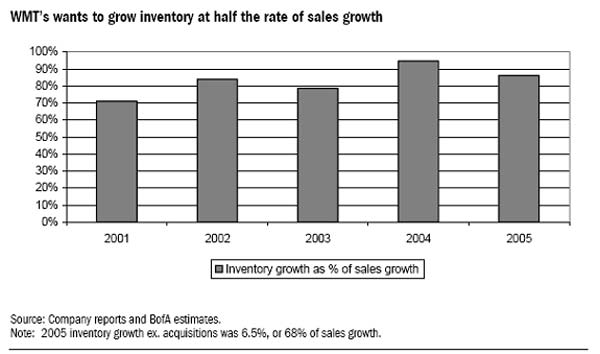
Finally, Gilmore noted in his piece that in the middle of the last decade, Walmart found inventories were rising much faster versus sales growth than had historically been the case, as shown in the chart below. Note inventory growth was more than 90% of sales growth in 2004 and in the high 80% range in 2005, versus just about 70% in 2001.
That led to the "Remix" program designed to reduce inventories and dropping of vendors and SKU counts to get back on track over the next few years. However, Walmart did bring some 8500 SKUs back to its shelves in 2011.
There's more, but that's probably enough. Quite an interesting story for business, the retail industry, and the supply chain.
Any reaction to this week's supply chain graphic? Let us know your thoughts at the Feedback button below.
|


