We've enjoyed the two parts of the Expert Insight columns on Supply Chain Risk Management from Infosys'
Mitul Shah. (See Talking Supply Chain Risk in a Language Everyone Understands - Money!!)
In the most recent of those two columns, Shah outlines an approach for better quantifying the value of supply chain risk mitigation strategies.
Shah illustrates a quantification approach using example risks from each of the Source, Plan, Make, and Deliver processes [using the SCOR model framework]. For each of these events, the probability and financial impact are derived. The probability is calculated using statistical techniques.
"Once the expected loss is arrived at for each of the potential supply chain risks across all functions, Risk Tolerance is applied," Shah says. "In statistical terms, this is a Confidence Interval. The higher the confidence interval, the lower is the organization’s risk appetite and vice versa. The Confidence Interval represents the expected coverage that the organization wants to achieve over all potential risks. Hence, the product of Expected Loss and Confidence Interval represents Value at Risk (VaR)."
That approach is illustrated in the graphic below.
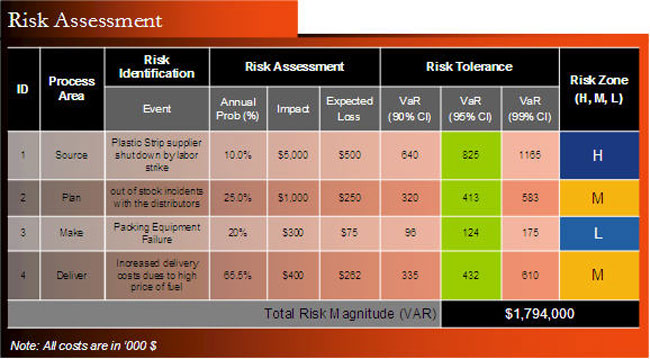
Source: Infosys
This VaR approach allows organizations to look at all potential risks through one metric and to prioritize mitigation efforts. While probability and impact are often used in risk analysis, we like the addition of the "Risk Tolerance" factor in this model.
Agree or
disagree? What is your perspective? Let
us know your thoughts at the Feedback button
below.
|


