Search
or Search by TOPIC
Search Supply Chain Videocasts
 
 
  Sign-Up Free Newsletter


Supply Chain News Bites - Only from SCDigest
 

-Aug. 20, 2009


Supply Chain Graphic of the Week: Green Supplier Scorecards


Direct Versus Indirect Measures; A New Level of Supply Chain Analysis


By SCDigest Editorial Staff


With the dramatic rise of Green Supply Chain thinking, it is clear that many companies will confront the need or desire to track the "Green-ness" of their supplier base.

But how will that actually be achieved? To date, virtually every report any company has offered has been dependent on self-reporting by suppliers. Wal-Mart has recently announced plans for scorecarding Sustainability performance by its suppliers, but how this will actually be implemented is not completely clear.

Among the key questions: will the Green measures be direct, or indirect? Meaning, will scorecards try to directly measure carbon emissions, or will they use other measures, such as metrics around transportation modes and efficiency, that drive overall Green performance?

It may wind up being a combination, but we think the indirect measures will be easier to capture - and likely be more accurate.

A draft of what such a Green supplier scorecard might look like in the area of transportation is presented below. That graphic was taken from the just released Supply Chain Digest Letter on The Green Supply Chain. You will find an e-copy of that Letter, plus a wealth of other resources, on our new sister web site, TheGreenSupplyChain.com.


Example Green Supplier Scorecard


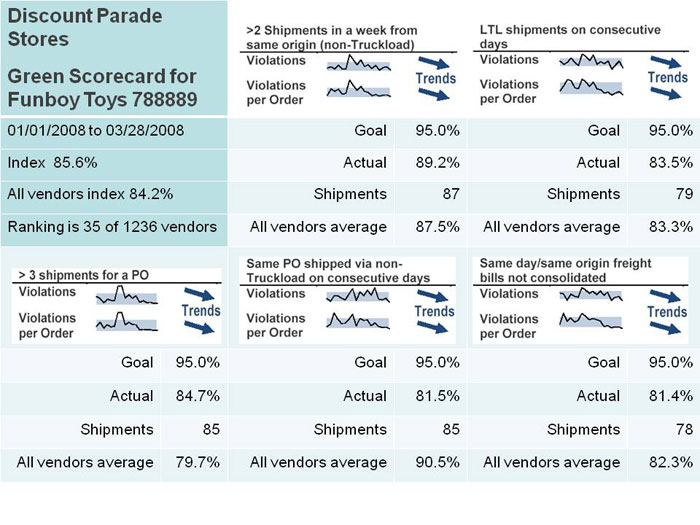
Source: Compliance Networks

The concept is simple at one level, but important at another: if a vendor has to ship a single PO in more than one shipment, that directly increases overall CO2 emissions for that order - in addition to transportation costs. Too often, companies have not well managed this, even at just a logistics level - Green Supply Chain adds a whole other dimension.

While many software companies have announced carbon calculators of one type or another, we've seen few examples of Green supplier scorecards. How a company thinks about direct versus indirect measurement will be an important decision point in their tracking systems development.


Agree or disagree? What is your perspective? Let us know your thoughts at the Feedback button below.


Send an Email
 
 
Feedback
2009-08-25

August 21, 2009

First, a little more explanation of the metrics may provide clarity.

Second, 'indirect' metrics may well be the most effective means of measuring performance. Likely easier to get measures from existing data sets, ties performance to factors that suppliers can influence (number of shipments, etc.) rather than more removed measures (CO2 emissions from carrier.)

However, a key aspect of statistics is to show that the 'indirects' have significant correlation to the 'direct.' It is unclear as to whether the metrics reflected here have this connection. Example: multiple LTL shipments on successive days may simply travel on equipment that makes these pickups and stops daily. While it is likely that shipping orders more completely will drive efficiencies -- certainly costs and likely carbon impact -- it may well take a change in transportation patterns (pick ups or deliveries every other day versus every day) to drive actual carbon change.

Other metrics to consider to reflect carbon impact of transportation:

(1) overall miles of transport (fewer overall miles drives lower overall emissions)

(2) - the mode of transport (rail vs TL vs LTL vs parcel) and the corresponding carbon output per mile

(3) - the carrier base (the carbon efficiency of the carriers used)

Miles - metric = miles traveled per volume sold (tons, cubic feet, etc.)

Metrics in article reflect this as fewer shipments drive fewer miles. An additional metric could be miles traveled per origin-destination distance. That is, how efficient is the routing -- the miles traveled compared to the miles between origin and destination.

Mode - metric = the carbon impact for origin to destination distance. e.g., while rail may have less carbon impact per mile traveled, if this mode requires further distance to get to destination (indirect route), and/or transloading (carbon footprint of facility and subsequent transit), it may have higher overall carbon impact.

Carrier base - metric = % of miles on 'carbon focused carriers.'

Carriers certainly have the ability to calculate their CO2 per mile. Of course, there are programs (Smartway, etc) that carriers can participate in to verify and communicate their commitment to carbon reduction. Metrics that capture the % of miles on 'carbon focused' carriers will drive improvements.

Corbin C. Fowler
Senior Manager, Supply Chain Solutions
MeadWestvaco


Related Videos Related News & Videos
Coming soon
Green Supply Chain News: SEC says Companies Should Disclose Climate Change "Risks" to Investors, in move that Could have Large Impact on Business
Green Supply Chain News: Review of the New Supply Chain Report from the Carbon Disclosure Project and ATKearney
Green Supply Chain News: Water Management Moves Center Stage
Green Supply Chain News: US Cap-Trade Prospects Dim, While France Prepares Fresh Carbon Tax
Green Supply Chain News: Now Some Say Cooling not Warming Period Coming
Green Supply Chain Graphic of the Week: Reducing Fuel Usage and Carbon Emissions in Logistics
   
Keywords
Green supply chain   Green supply chain


Supply Chain Digest Home | Contact Us | Advertise With Us | Sitemap
© 2006-2009 Supply Chain Digest - All Rights Reserved