Where is the real spending in terms of research and development, which in the end is the driver of innovation and competitive advantage?
Perhaps surprising to some, the developed economies in the US, Europe and Japan still account for the overwhelming preponderance of total R&D spend worldwide. As shown in the graphic below, from research just published by Booz & Company, those three regions account for an amazing $463 billion of the global total investment of $492 billion in 2007.
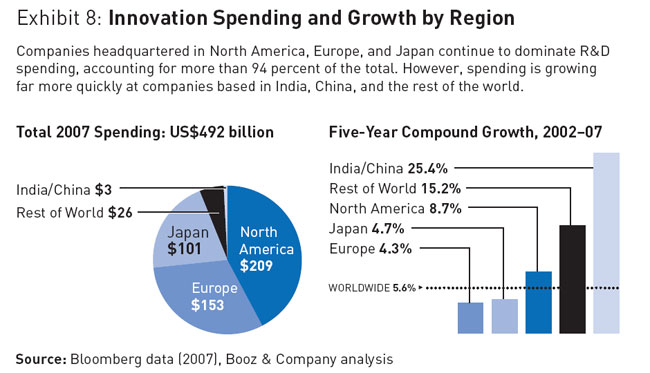
However, as usual, there are some side stories. First, the growth rates in R&D spend are much, much higher in developing countries. The compound annual growth rates for R&D over the five-year period from 2002-2007 are an equally astounding 25.4% in India and China combined, and 15.2% in other developing countries.
Still, the rate of growth in R&D was a very respectable 8.7% in North America/US, but just 4.7% and 4.3% in Japan and Europe, respectively.
Some observers, however, say that China may still be getting off on the cheap, leveraging and, in some cases, pirating Western R&D to boost their own economic prospects.
Agree or
disagree? What is your perspective? Let
us know your thoughts at the Feedback button
below. |


