Supply Chain network analysis and supply chain risk management both continue to be hot areas of the supply chain - perhaps even more urgently now with accelerating economic and supply chain dynamics.
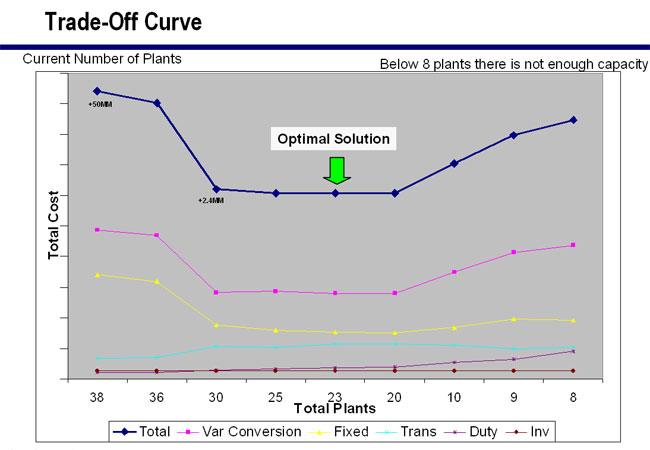
But how to balance cost and risk? The graphic below shows how supply chain network analysis can provide critical insight. As presented in a recent SCDigest Videocast on "Achieving Flexible Supply Chain Strategies" by Dr. David Simchi-Levi of MIT, based on data from a real manufacturer, the optimal solution for one company from a pure cost basis would be to reduce the company's current plant network from 40 to 23.
But is that the smart decision? Probably not. The cost curve flattens out dramatically at a 30-plant network. The further savings from closing an additional seven plants is small - but adds substantially more risk. Therefore, the 30-plant network design likely is the right decision.
Source: Dr. David Simchi-Levi
One of the other important upshots of this insight is that, in many cases, the difficult effort to "quantify" supply chain risks may not be necessary. As in this case, the additional benefits from what are intuitively more risky decisions may flatten out, showing it makes little sense to take on more risk.
This excellent Videocast is available on-demand: Flexible Supply Chain Strategies.
Agree or
disagree? What is your perspective? Let
us know your thoughts at the Feedback button
below. |


