With all the supply chain activity and sometimes political fallout related to offshoring and imports, SCDigest was interested in the numbers recently presented by Dr. Gene Huang, Chief Economist for FedEx.
At the recent Health and Personal Care Logistics Conference in Sarasota, FL, Huang presented the chart below, which shows the percentages of world import and export volumes by global geographic regions from 1998 to 2006.
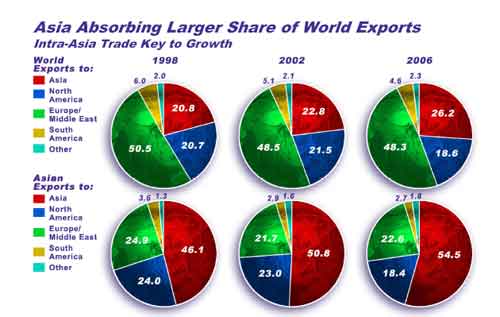
Source: Dr. Gene Huang, FedEx
A couple of interesting points jump out. First (looking at the bottom set of pie charts), despite substantial growth in US imports during this period, the share of total imports from Asia coming to North America versus other regions is actually shrinking (24% in 1998 versus just 18.4% in 2006).
Second, there is a tremendous rise in exports to Asia, rising from 20.8% of total exports in 1998 to 26.2% on 2006. We suspect much of this growth is driven by exports within Asia (e.g. China to Japan), nonetheless, the data is interesting, showing the tremendous growth in world trade globally.
Agree or disagree? What is your perspective? Let us know your thoughts at the Feedback button below.
|


