sc digest
 
Sept. 18, 2020 - Supply Chain Digest Flagship Newsletter
border

This Week in SCDigest

bullet Walmart and Amazon by the Numbers 2020 Part 2 bullet SCDigest On-Target e-Magazine
bullet Supply Chain Graphic & by the Numbers for the Week bullet New Stock Index
bullet

New Cartoon Caption Contest

bullet Trivia      bullet Feedback
bullet New Expert Column bullet On Demand Videocasts
THIS WEEK'S SPONSOR:


A new report from ARC Advisory analyst Clint Reiser lays out the
landscape across WMS, WES and Warehouse Control System (WCS)
software, detailing the WES value proposition, and describing
important changes in the WES market.


first thought

SUPPLY CHAIN NEWS BITES


Supply Chain Graphic
of the Week
The Top US Global Trade Gateways


This Week's Supply Chain

by the Numbers

bullet
FedEx Feeling Pricing Power
bullet
Factory Workers Leaving Job to Tend to Kids
bullet
US Manufacturing Rally Stalling

bullet

Huge Numbers of Ocean Freight Carriers Stuck at Sea


NEW CARTOON CAPTION CONTEST!

July 30, 2020 Contest


Show Us Your Supply Chain Wit

It' Back! SCDigest's Weekly

Supply Chain Stock Index


IMPORTANT SURVEY - NEED YOUR HELP
The State of Retailer-Vendor Supply Chain Relationships 2020


Are Things Getting Better and More Collaborative - or Heading in the Other Direction? Third Biannual Study - Please Participate


ONTARGET e-MAGAZINE

Weekly On-Target Newsletter:
Sept. 16, 2020 Edition

Cartoon, Top SCDigest Stories of the Week


NEW EXPERT COLUMN
Revisiting SCDigest's Framework on RFID Process Change


Dan Gilmore


What to Do about Lack of Gender Diversity in Supply Chain Management


Abel Tamanji

Senior Student at University Of Wisconsin-Whitewater


TRIVIA QUESTION
How many ports of entry are there international cargo in the US?
Answer Found at the
Bottom of the Page


Walmart and Amazon by the Numbers 2020 Part 2

My column a few weeks ago on Walmart and Amazon by the Numbers 2020 once again proved very popular. I am very pleased to be backed this week with part 2, as we dig into the data from the world's two most important retailers.

GILMORE SAYS:

Importantly, Walmart also has to pay a dividend from its cash flow- $6.0 billion worth last year - while Amazon does not.


WHAT DO YOU SAY?

Send us your
Feedback here

To first put the numbers from both of my columns in perspective, let's first look at the rise of US ecommerce. According to the Commerce Dept., ecommerce sales were about 12% of total retail sales last year, up from about 9.9% in 2018 - but those total retail numbers include sales of cars, gas stations, restaurants and a few other categories that are not really relevant for comparison.

So, we run the numbers based on the same formula we used in part 1 of this series to analyze Walmart's share of US retail, for which we take total retail and subtract out those non-relevant categories . Using that formula, ecommerce sales were a much higher 16.3% of total US retail sales in 2019, up strongly from 14.9% in 2018, as shown in the graphic below. Of course, that share is much higher in some product categories, such as electronics and apparel and growing daily.


The share of ecommerce sales have amazingly taken off even faster this year in the face of the pandemic and the stay/work at home economy.


Even using the Commerce Dept.'s overstated denominator, the government says ecommerce sales jumped from 11.8% in Q1 of this year to 16.1% in Q2. Using my formula that subtracts non-relevant categories, the number would be more than 20%This is obviously the key retail battleground.


See Full Size Image


In my first column, we also graphed the annual percentage growth for Walmart's US retail sales, which slowed noticeably a few years back but have rallied a bit the last few years before a flat 2019. Below we show the Walmart numbers in absolute terms across its three reporting units: US, Sam's Club, and International. All units have seen the pace of growth slow sharply, though US store sales were up a fairly strong 3.0% in 2019. The on-going big slowdown in international remains a bit puzzling.


See Full Size Image


The cumulative average revenue growth rate (CAGR) for each unit and total sales since 2015 is shown above the main chart. Walmart has had a CAGR of 5.1% for total sales from 2002 through 2019, but that clearly came much more from the first half of that period than the last few years. Since 2015, total revenue has grown 2.09% annually, with international actually falling 0.7% per year, Sam's Club basically flat at 0.83% annual growth, and surprisingly the fastest growth in the most mature segment, US retail, at 3.4%. Still the wimpy 1.8% total revenue growth in 2019 represents more than $9 billion in new revenue - and that's a good sized retailer on its own.

Switching gears, Amazon for years received much criticism for its consistent failure to really make any money, but that started to change in 2016 and really jumped in 2018, as can be seen in the chart below. Net income for 2019 was $11.5 billion, up 11.5%, and reached 4.1% of sales, both those numbers easily setting company records.


See Full Size Image


However, it's worth noting that 28% of its operating income came from its AWS web services unit.


Walmart, by comparison, had profits of $14.8 billion last year, not that much more than Amazon, and which represented only 2.8% of sales, lower than Amazon's margin percent.


For years some said to look at Amazon's cash flow from operations instead of profits, a view which has painted a more favorable picture when profits were low.


Operating cash flow as a percent of revenue has generally been much higher at Amazon than at Walmart for many years - and was more than two times so in 2019, as shown in the chart below.


See Full Size Image


In fact, despite having about half the revenue of Walmart, Amazon again had higher operating cash flow in absolute terms last year, at $32.1 billion versus $25.2 billion for Walmart.


But there is operating cash flow and then what is called "free cash flow," or operating cash flow minus capital expenditures, and here the story is also interesting.


Amazon had that $32.1 billion operating cash flow in 2019, and had CapEx of about $16.8 billion, up from $13.4 billion in 2019. So that means CapEx was 52.3% of operating cash flow, up from 44% in 2018. Lots of fulfillment centers still being built.

Walmart, on the other hand, had CapEx of about $10.7 billion - up just a bit from $10.3 billion in 2018. With $25.2 billion in operating cash flow, that means CapEx of about 42.4% of OCF, though with Walmart now generating less OCF than its rival. (Note: as a proxy for official CapEx, I am using spending on real estate, equipment and technology).

Importantly, Walmart also has to pay a dividend from its cash flow- $6.0 billion worth last year - while Amazon does not. So Amazon's operating cash flow minus CapEx spend = $18.6 billion in 2019. Doing the same calculation with Walmart but also subtracting the dividend leaves it with $8.5 billion in free cash. That is less than 50% of Amazon's total, and is lower for just the second time, with the first in 2018.


The dividend factor is huge and a giant advantage for Amazon while it lasts.


I have lots more, but I am out of space. Hope you have enjoyed this look at the numbers.


Any reaction to these numbers from Amazon and Walmart? Any other data you would like to see? Let us know your thoughts at the Feedback button or section below.


On Demand Videocast:

Understanding Distributed Order Management

Highlights from the New "Little Book of Distributed Order Management"

In this outstanding Videocast, we'll discuss DOM, based on the new Little Book of Distributed Order Management, written by our two Videocast presenters.


Featuring Dan Gilmore, Editor along with Satish Kumar, VP Client Services, Softeon.

Now Available On Demand

On Demand Videocast:

The Grain Drain: Large-Scale Grain Port Terminal Optimization


The Constraints and Challenges of Planning and Implementing Port Operations


This videocast will provide a walkthrough of two ways to formulate a MIP, present an example port, and discuss port operations.


Featuring Dan Gilmore, Editor along with Dr. Evan Shellshear, Head of Analytics, Biarri.


Now Available On Demand

On Demand Videocast:

A Blueprint for WMS Implementation Success


If You Want a Successful WMS Project, You will Find the Blueprint in this Excellent Broadcast


This videocast lays out the keys to ensuring your WMS implementation goes smoothly, involves minimal pain, and accelerates time to value.


Featuring Dan Gilmore, Editor along with Todd Kovi of Radix Consulting and Dinesh Dongre of Softeon.


Now Available On Demand

YOUR FEEDBACK

After our column last week noting we've turned from toilet paper shotages to "where's the beef?", our friend David Schneider of David K. Schneider & Company sent us this nice email explaning how the meat supply chain works. Now you know!


Feedback on the Meat Supply Chain:


For beef (and lamb/sheep), there are two stages of meatpacking - Primal and Final.

Primal Cuts are the large cuts - whole sections of the animal, cut away from the carcass, later packed for processing into final cuts.

Some of the larger packing operations run from kill to final in the same complex - the traditional way that people think of a meatpacking plant. But many of the new massive campus operations, including the JBL and Tyson sites in the news, ship under long term contracts meat packaged for retail or portion control use.

For decades the meat supply chain operated at two levels; packing houses that shipped primal-and sub-primal - packaged into vacuum bags and frozen for shipping to grocery stores - where meat cutters cut and package the final cuts for sale at that location.

Today, a sizable portion of the production from the kill line is still primal to package and shipped to other companies/facilities that do the Final cuts. Most of the consumers of primal and sub-primal are wholesale distributors, local butchers, Costco, and Asian grocery, where there is still local meat cutting.

A large portion of the US grocery market no longer operates local meat rooms in their retail locations. Walmart is one significant example of the retail scene, as is most of the Royal Dalheize group (Stop-n-Shop, Giant), Aldi, Lidl, and other growing chains. Those contracts with retailers are under tight margins, costs supported by the typically much higher foodservice contracts with bigger and steady margins.

The supply chain innovation that Tyson, JBL, and the rest employed was centralization and concentration of labor into these large campuses - close to the production of the animals. Our modern network of refrigerated logistics - temperature controls trucks and warehouses - helps facilitate the consolidation of the final steps of meat cutting from local to the market to local to the source.

Primal cuts flow between companies in the meat industry like cash - and interesting features in the USDA regulations allow for long term freezing of primal cuts that can sell later as fresh meat. There are times where hundreds of millions of pounds of frozen primal cuts sit in 3PL freezer warehouses. I suspect at this moment, hundreds of millions of pounds of frozen primal cuts sit in warehouses, unable to move to the market because there are fewer places that can do the final cut. I suspect the owners of this meat don't want to ship these cuts because to ship now erodes the future profit margin of the packaged and portion-controlled product.

The COVID virus exposes a substantial risk of consolidation and full-integration of production in the supply chain.

David K. Schneider
David K Schneider & Company, LLC    


SUPPLY CHAIN TRIVIA ANSWER

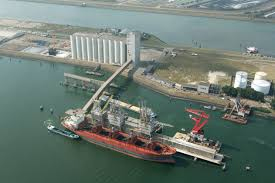
Q: WHow many ports of entry are there international cargo in the US

A: 467

Copyright SupplyChainDigest 2003-2020. All Rights Reserved.
To Unsubscribe from Supply Chain Digest emails: Click Here
 

This email was sent by SupplyChainDigest
PO Box 714, Springboro, Ohio 45066

POWERED BY: XDIMENSION