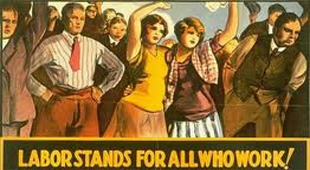
The Labor (Day) Supply Chain 2016
Monday of course marks the annual Labor Day holiday both here and in Canada. Starting in 2011 I decided to do a column on the state of the labor supply chain in conjunction with this event. It was popular enough that I have continued on each year since. It's a lot of work.
At one level, the labor movement in the US continues to weaken - though there are other areas of success. The percent of total US workers that were union members was flat in 2015 at 11.1%. Unionization in the private sector was up just a tick to 6.7%.
But the long-term trend is one of steady decline since the Labor Department started reporting it in 1983, when overall unionization was at 20.1% and 16.8% in the private sector, with those numbers themselves well down from previous decades before it was tracked.
| GILMORE SAYS: |
Retailer American Apparel, which has been producing in LA for years, now says with the min wage headed higher there it likely will stay in the US but move production to the Southeast.
WHAT DO YOU SAY?
Send us your
Feedback here
|
Conversely, public-sector workers had a union membership rate of 35.2%. Together, there were 14.8 million private and public sector employees in a union in 2015, little different from 2014, and down from 17.7 million in 1983 when the total US labor force was much smaller.
There are also huge differences between states. Five states had union membership rates below 5% in 2015: South Carolina (2.1%), North Carolina (3.0%), Utah (3.9%), Georgia (4.0%), and Texas (4.5%). Conversely, two states had union membership rates over 20 percent in 2015: New York (24.7%) and Hawaii (20.4%).
The number of US manufacturing workers that are union members fell in 2015 to 9.4% from 9.7% in 2014. Those numbers are a bit lower than the percent of workers covered by union contracts, such as those that opt out in right-to-work states, which was 10.0% last year and 10.5% in 2014.
Ponder that - less than one in ten US manufacturing workers are unionized today, versus 17.5% in 1994 and, according to unionstats.com 38% of private sector manufacturing workers in 1973.
Don't think this downward union trend is only a US phenomenon. Unionization rates in labor-loving Sweden, for example, have fallen from about 90% in the mid-1990s to around 70% today. Many other countries mirror US unionization rates more closely. Unionization in France - generally considered very supportive of labor - almost exactly follow the US patterns, and are actually just below the US in the percent of all workers unionized. Union membership is higher in the UK, at about 25%, but that's down from more like 40% in the mid-1990s.
In July, there were about 8.6 million non-supervisory manufacturing workers in the US, down just a bit from 2014. That's up from the bottom of the recession, when we fell to about 8 million shop floor workers, meaning we've added about 600,000 manufacturing jobs since then. But in 2004, there were just over 10 million factory floor workers - we're down 1.4 million positions from that level.
That obviously puts downward pressure on wages, as the demand for workers is simply much lower than the supply, though the lack of wage growth isn't nearly as bad as I would have guessed, based on all the media reports.
According to the BLS, the average hourly wage (I believe including benefits) for shop floor manufacturing workers was about $20.47 in July, up from 19.95 or about 2.6% year over year - not bad. That's also up from the $16.78 or so per hour in July 2006, or a rise of 22% over 10 years. That a cumulative growth rate of 2.%, So wages have risen modestly, about equal with inflation, so not enough to improve a worker's lifestyle, while healthcare costs take more and more of the pay.
Meanwhile, there has been steady growth in warehouse jobs, though they represent just a tiny fraction of manufacturing positions. There are now about 747,000 warehouse workers in the US, up from some 597,000 in 2004, a rise of 25% - but even with that growth they only represent about 8.7% of manufacturing floor jobs. That surprises me, actually, though that percentage continues to slowly tick up. (I'll note many jobs at plant warehouses may be counted as manufacturing jobs.)
In terms of wages, average non-supervisory pay for warehouse workers was $15.80 in June, up 2.2% year over year. That's also about 23% less than average manufacturing rate. Pay for warehouse workers was at $15.09 in 2006, meaning DC wages have risen only 9.5% over the past decade. Wow.
OK, those are some of the key facts. Now let's look at some of the key events and trends relative to labor over the past year. There is a lot to summarize.
The $15 minimum wage movement progressed a bit, with the states of California and New York joining cities such as LA, San Francisco and Seattle in mandating the change over several years, though the New York plan varies by area of the state. Even some observers on the left are recognizing a one-size fits all approach for raising the minimum wages may not make sense and cost jobs. Gov. Chris Christi just vetoed the passage of a $15 minimum wage plan in New Jersey.
Retailer American Apparel, which has been producing in LA for years, now says with the min wage headed higher there it likely will stay in the US but move production to the Southeast.
There were really no signature labor battles as there have been in recent years (such as failed unionization of a VW plant in Tennessee). It appeared there might be a series of contract standoffs between steel makers and the union, as the plants were asking for give backs in the face of plummeting prices for steel.
But strikes were largely avoided, and the union contract with giant ArcelorMittal, as an example, had zero wage increases for three years, but with bonuses baked in if steel prices rise, and largely kept very generous healthcare benefits that Arcelor had first sought to roll back.
There were scattered protests in Q1 by workers protesting the partial closing of a long-time Mondelez International (formerly Nabisco) plant in Southwest Chicago making Oreos and other snacks, with plans to move half the operation to Mexico and kill 600 jobs. The move became part of the political conversation for awhile, but that didn't save the plant, which made its last Oreo on Kedzie Ave. in July.
 Carrier Corp. came under much criticism when it announced in March it was going close a manufacturing plant in Indianapolis and move operations to Mexico, costing 1400 jobs. But the negative publicity didn't seem to last very long. About the same time, Ford announced it was going to invest $1.6 billion to construct a new small car assembly plant in Mexico and create 2600 jobs there, also causing some political backlash for awhile - but Ford says it can't make small cars profitably in the US. Carrier Corp. came under much criticism when it announced in March it was going close a manufacturing plant in Indianapolis and move operations to Mexico, costing 1400 jobs. But the negative publicity didn't seem to last very long. About the same time, Ford announced it was going to invest $1.6 billion to construct a new small car assembly plant in Mexico and create 2600 jobs there, also causing some political backlash for awhile - but Ford says it can't make small cars profitably in the US.
The late December 2014 NLRB approval of new rules for so-called "microwave" union elections has had an impact in hurrying union votes, as intended, but not the results. Time to election is now averaging 23 days in the past year, or 34 for contested elections, compared with 38 days in the prior year, or 64 in contested elections. But unions are still winning about two-thirds of the vote, as before the change.
In 2015, the US Labor Department announced new rules relative to overtime pay, increasing the minimum weekly salary threshold under which salaried workers are eligible for overtime when they work more than 40 hours in a week to $47,500 annually, starting this Dec. 1. The current threshold is much less, at $455 per week or about $24,000 per year. The impact on the supply chain is unclear, but certainly this change could affect for example many warehouse or manufacturing supervisors whose pay falls in that range. That means labor costs could go up - or more likely companies will make sure those managers work little overtime.
The on-going battle on how contact employees are classified continued on in many venues. Ride sharing giant Uber settled a lawsuit in 2016 for $100 million with a large group of drivers saying they should have been classified as employees - but now a judge says that wasn't enough. Uber's whole model is in jeopardy. Perhaps more ominously, in late 2015 the NLRB issued a decision requiring Browning-Ferris Industries to negotiate with the Teamsters union representing workers who were actually employed by a contractor operating at a waste disposal facility. Browning-Ferris has appealed the decision, but meanwhile the NLRB has issued additional similar decisions on companies using employees from contract firms, like a 3PL. This could be huge.
Finally, in August the NLRB updated a "clear successor" rule making it easier to impose union contracts on the buyers of companies instead of allowing freshnegotiations.
There's a lot more, but I am well out of space. So, little if any general labor progress, but governmental/court actions are moving in labor's favor. Here come the robots.
Any reaction to our summary of the labor supply chain 2016? Let us know your thoughts at the Feedback button below.
|