 |
February 14, 2013 - Supply Chain Newsletter |
 |
| FEATURED SPONSOR: VOCOLLECT |
 |
Download the Vocollect Voice iPad® App for an In-Depth Look at how
Vocollect can Help Deliver better Operating Results. |
 |
|
|||||||||||||||||||||||||||||||||||||||||||||||||
2013 Priorities: Mapping and Modeling Your Supply Chain
|
||||||||||||||||||||||||||||||||||||||||||||||||||
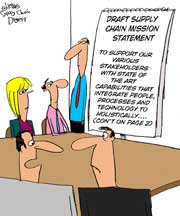


| GILMORE SAYS: |
"As Toyota executive vice president Shinichi Sasaki said at the time, "Our assumption that we had a total grip on our supply chain proved to be an illusion." WHAT DO YOU SAY? |
So I am going to start with the mapping part today, and we'll finish with the modeling imperative next week. My original intention was to do both in one column, but I found there just isn't room.
So consider this: In the Spring time frame of last year, Toyota announced a number of steps designed to help it mitigate the type of supply chain disaster it experienced after the Japanese earthquake and tsunami in 2011. That disruption cost it hundreds of millions of dollars and for a while its place as the largest automotive manufacture in the world.
That impact came in large part not so much from damage to Toyota's own facilities, but rather from the huge challenges the company had getting parts or assemblies from tier one suppliers. In turn, that was often because those tier 1s could not get parts or materials from tier 2 or tier 3 suppliers, many of which Toyota did not even know were cogs in its supply chain.
So here we have supply chain icon Toyota being in effect blind to a significant portion of its own supply chain. As Toyota executive vice president Shinichi Sasaki said at the time, "Our assumption that we had a total grip on our supply chain proved to be an illusion."
Sometime in 2011, Toyota undertook what must have been a massive effort to map its full supply chain, and when the news about the project came out last March news, the company said the effort could only be 60% or so completed, because some tier 1 suppliers would not disclose their own vendors for competitive reasons.
Why am I pretty confident that this effort was massive? Because last year on one of our videocasts, Dr. Tom Choi of Arizona State University described his project to fully map the Honda Accord supply chain for just one sub-system - the center console. Based on a grant from the National Sciences Foundation, the effort took him three years, and provided Honda with visibility it simply didn't have for just that one system, let alone an entire automobile (see graphic below - actual supplier names have been genericized).
You most likely have also seen the news about the fire at the apparel factory in Bangladesh in late 2012 that killed more than 100 workers in a plant that was a walking fire trap with no exit doors in many areas of the building.
That already big news turned into a bigger story when it was discovered the facility was making products for store shelves at Walmart, Sears and other big name retailers, most of which said they did not even know the factory was one of their suppliers.
How did this happen?
Walmart gave one supplier a large contract for garments that was beyond the capacity of that supplier on its own, so it sub-contracted some of the work to others, including the fatal factory.
Jahangir Alam, an officer for ethical sourcing at Walmart's office in Dhaka until late 2011, said at the time that "with multiple sub-contracts going on, it has become almost impossible for buyers to practice ethical sourcing in the true sense." In others words, they really did not know Walmart's true supply chain.
Just in the past few weeks, Walmart has now issued tough new guidelines that bar suppliers from sub-contracting work to any facility it doesn't know about. But as big as Walmart is, it's just one company.
And of course, if you have been following the bizarre story of horse meat (and maybe even donkey meat) entering the retail and restaurant supply chain in parts of Europe for what was supposed to be all beef, you will know it was again the work ( it appears) primarily of a rogue supplier working for the main vendor. (See our Supply Chain Video News with CSCMP on Monday morning for more details on this on-going scandal.)
And while we are on this topic, sales at Yum Brands' hugely successful KFC stores in China plummeted 41% in January, after excessive levels of antibiotics, which accelerate growth, were found in its chicken. The stock price has tanked.
So the question again is: do you really know your full supply chain?
Within a few weeks of each other early last year, Toyota and my friend David Simchi-Levi of MIT started talking about the concept of time-to-recovery, or TTR. Toyota stated then it had set a goal of reducing its supply chain TTR at each facility from six months to just two weeks.
And as Simchi-Levi has brought into relief with his innovative "Risk Exposure Index," TTR of course drives the total financial impact (FI) from a supply chain disruption, and together TTR and FI enabling companies both to assess what risk mitigation strategies might be worth and the value of lowering TTR.
But Toyota obviously can't reach its goal if it doesn't have clear visibility to its full supply chain. If a specific single source tier 2 supplier goes down for three months, it is possible that the tier 1 supplier downstream is then also down for three months as well? What parts are in fact single sourced by suppliers? Does that source have multiple production facilities? Are there other sources for the part in the larger marketplace? Are all the suppliers for this product or category in the same geographic area, meaning a single natural disaster could wipe out all the supply (as happened in some categories from the Japanese earthquake and then later with the Thailand flooding).
(By the way, the Toyota suppliers that would not disclose some or all of their own suppliers are making commitments to work with Toyota to achieve the same two-week TTR goals).
Or, switching industries, can you fully trust that a tier 1 food supplier isn't using slaughterhouses that are mixing in some horse meat or farms that are using too much antibiotics?
On the same videocast reference above, Tom Linton, now chief procurement officer at LG Electronics, noted other problems with "outsourcing your bill of materials" to tier 1 suppliers.
For example, when he was previously at Flextronics, Linton said there was naturally much angst and uncertainty in early 2009 after the financial crisis as to whether the electronics industry would recover relatively quickly, or stay in the dumps as it had been for several months. The market direction chosen would have big impacts on manufacturing capacity planning, inventory levels, etc.
Having previously taken the step of mapping its supply chain, Linton visited some of the tier 2 or 3 semiconductor foundries with which it did not do business directly - and he saw that electronics business was strong and recovering, if not yet clear at the end of the chain. This enabled Flextronics to get a several months jump on some competitors in preparing for the rising demand that did in fact occur, a jump worth tens of millions of dollars to the company in the end.
There is no doubt that mapping your full supply chain is a big effort, and the bigger a company is likely the more massive that effort is.
I used to think Apple's supply chain had become a bit over-rated, just meaning it seemed as Apple's product portfolio and innovation took off, then suddenly people were talking about Apple's supply chain prowess when in fact it was rarely called out for supply chain before the iPod and iPhone.
But I am changing my mind on this, in part because Apple clearly has not "outsourced its bill of materials," and maintains clear visibility and control of its extended, multi-tier supply chain without owning any of it.
So: to map your supply chain is to know your supply chain. And interestingly enough, mapping your supply chain (at least in part) is generally also where you start in a supply chain modeling effort. And that is where we will continue next week, including some really smart comments from our own expert Dr. Michael Watson of Northwestern University.
Do you agree it is time more companies map their full supply chains? Have you done so? Let us know your thoughts at the Feedback button (email) or section (web form) below.
![]()
| View Web/Printable Version of this Page |
|
|
|

YOUR FEEDBACK
Just to reinforce that we are pretty straight shooters here at SCDigest, we mostly feature this week. a couple of fairly critical emails we received in the last week commenting on the way we covered two separate stories: one on the rejection of the leadership-approved new contract by the clerical workers union rank and file at the ports of LA and Long Beach, and another on a recent graphic of the week on the change in global temperatures over the past century.
We reviewed how we did it in both cases based on this Feedback, and feel very very comfortable with how we covered both stories, as explained in the Editor's Note following each comment. But you can judge for yourself.
Feedback on Temperature Chart:
I am extremely disappointed in SCDigest for including this story in what I've always regarded as an authoritative source of supply chain related information. http://www.ucsusa.org/publications/got-science/2012/got-science-november-2012.html Paul Brunning Editor's Response: Thanks for writing. You may not like the Cato Institute, but the data in that chart is not theirs directly. We just happened to find their version of it from NASA numbers or whoever it was. As per the links provided, there are many that don't like Cato's conclusion or perspectives, but the temperature patterns/data points in that chart I do not believe are at all in dispute. I found this graphic. It appears Cato was using the NASA numbers, in the pink.
I found those temperature patterns interesting, and they were something I didn't know. But appreciate the Feedback.
Dan Gilmore |
||
| Feedback on Clerical Workers Reject Contract | ||
I am in favor of critical analysis of events but what I see in your article is a very biased response to the Union's rejection including what appears to be out-of-context comments vilifying the union. You state that, "At this point, it is not clear what the union is unhappy with in this new contract." I would be more likely to feel that this was a fair and honest report if you stated that we contacted a spokesperson from the Union (and include their name) and here is their side of the story. There is nothing in your article that states the Union's side of the story. Nor is there anything that indicates that you made any attempts to get their side of the story. As a consequence, it appears that you believe that the Union is in the wrong no matter what their position is. I certainly can't make a judgment based on the information in your article. I should add that I come without any preconceived notion of the validity of each party's positions (as your article introduced me to this subject). In short, it appears that your journalistic standards are not a high priority and I would have hoped that you would do better. Buddy Hoffman Editor's Note: Thanks for writing. Virtually every report on this was similar: http://www.latimes.com/business/la-fi-ports-strike-20130209,0,5507291.story As you can see, the union was not making statements about the underlying reason for the rejection. "The union and employers aren't talking about why some members went thumbs down on a settlement, which was celebrated by both sides at its Dec. 4 unveiling and initially appeared headed toward easy ratification." the LA Times wrote. Likely because the union itself is trying to figure that out, given its leadership had approved the contract obviously (that's why it went for a vote). The union may be as perplexed as most of the rest of us are. At the time the deal was reached, the union leadership was in a sense bragging about what a good deal they reached. Given that, the statement "At this point, it is not clear what the union is unhappy with in this new contract." seems perfectly reasonable to me. Probably should have added there was no comment at that point from the union (nor still) but we were rushing to get this important story out. Dan Gilmore |
||
Is it time for a Reagan era response to the Longshoremen? Reference of course to the Air Traffic Control situation that Reagan had the fortitude to face. At what point do we say - enough is enough? Our port productivity is one of the lowest in the world, and why do we continue to be held subject to the incredible demands of our port workers? Ports around the world out perform and provide a very high level of service at much different levels of compensation. Why do we accept less? Roger W. Woody
|
SUPPLY CHAIN TRIVIA ANSWER
Q: What was the peak year for US manufacturing output to date?
A: Perhaps surprisingly, 2007. After the dramatic drop in manufacturing output in 2008-09, the steady rise since then has still left US manufacturing levels about 5% below 2007 levels.
| © SupplyChainDigest™ 2003-2013. All Rights Reserved. SupplyChainDigest PO Box 714 Springboro, Ohio 45066 |
POWERED BY: XDIMENSION
|