|
Last week, we reviewed the first half of 2013 in terms of key events and news stories (see 1H 2013 Supply Chain in Review). As promised, this week we'll do a similar review but "by the numbers," with some nice charts thrown in.
On the economic front, as noted last week, Q1 US was just revised down to real growth (factoring out inflation) of only 1.8%, while many have also ratcheted down Q2 estimates (the actual number will come out in a few weeks) to just 1% or so, as inventory levels have been declining. 2012 levels were: Q4 - 0.4%; Q3 - 3.1%; Q2 - 1.3%; Q1 - 2.0%.
So this is just the reality. With one exception, Q3 of last year, growth has been barely positive. Since Q1 2010 (see chart), real growth has averaged just 1.9% per quarter, including the Q2 estimate - not good, but a lot better than Europe.
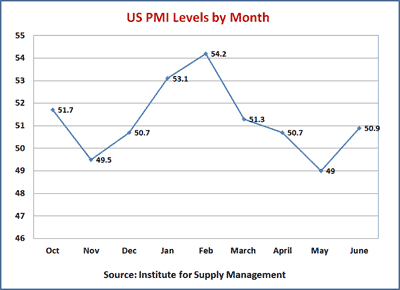
The US manufacturing sector has generally been a bright spot all along in the weak recovery, and that largely continued in the first half, when compared to the weak GDP numbers. The Purchasing Managers Index from the Institute for Supply Management was over the 50 mark that separates expansion from contraction for every month but May, when it dipped to 49%, followed by a better 50.9 score in June. However, as can be seen in the chart below, the level of growth has been dropping since the start of the year.
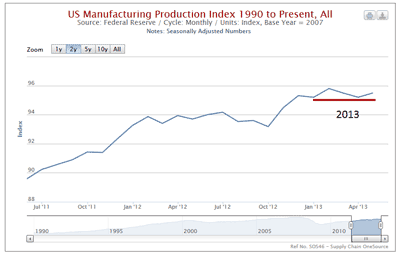
Another view of manufacturing is the level of manufacturing output. As we have noted many time, we have still yet to recover from the drop in output of more than 20% at the bottom of the recession in June, 2009. At an current index level of 95.5, that means US production is still more than 4% below its peak output in the base year of 2007. Output was basically flat in the first half of this year after a modest ramp up in late 2102, again indicating a wobbling economy.

View Full Size Image

View Full Size Image
In general, input and commodity costs continued their more than two-year downward slide. Metals prices really slumped, down 15% across the nine industrial metals we follow in 1H, though steel was closer to flat.
West Texas Intermediate was an exception to the downward trend, up 5.6% in the first half on the spot market, and rising rapidly both in the spot and futures markets so far in July. Crude oil futures started the year off at about $93 per barrel and are now over $105, though most of that rise came in July (see chart).
The Thompson Reuters/Jeffries Commodity Price Index at the end of June was down 24% from its recent peak in Q2 2011, almost in a straight diagonal line.
Diesel prices were largely flat, starting the year at $3.92 for national on-road prices, and ending June at $3.83, which was the weekly low for the year. The high mark was $4.16 in late February, meaning a delta from peak to trough of about 17%.
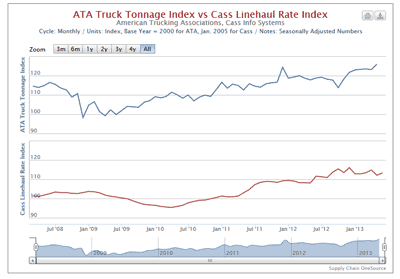
From a logistics perspective, trucking volumes have been up fairly strongly for the year, with the ATA Freight Tonnage Index rising from 121.7 in December to 126 in May - a record high (the June number will probably be released today). That means freight volumes are now 26% above year 2000 baseline levels, a level the index actually fell below for parts of 2009.
But even with truckload carriers generally keeping a strong lid on capacities, and freight volumes up 4% or so in the first half, there has not been that much upward pressure on rates. Below we contrast the ATA index change to the Case Linehaul Rate index, which has actually drifted down a percent or two since the start of the year.

View Full Size Image
Ocean container shipping continued to be in favor of shippers and importers. The Shanghai Containerized Freight Index, which tracks spot market rates for shipping 40-foot containers rates rose at the end of 2012 and through the beginning of this year, but have since seen a experienced a consistent decline. Rates are now well below prior-year levels, with shipments to the US west coast down 31% year-over-year and down 22% on East coast port sailings. Rates to Europe are down in the 50-60% range.
E-commerce sales keep chugging along, totaling $61.4 billion in Q1 – that's up 15.8% over Q1 2012, according to the Census bureau. By the way we figure it, that makes e-commerce about 7.5% of applicable total retail sales, when you strip out automobiles, restaurants and gas stations.
Ok, that's it. If we missed some numbers you would like to see, send me a note at the feedback button below.
Any reaction to these 1H 2013 supply chain numbers? Let us know your thoughts at the Feedback button (email) or section (web form) below.

|