Despite some predictions from real estate sector executives that we would likely see some slow down in the market for warehouse and distribution space towards the end of 2017, it appears those predictions were premature, as Q3 reports from JLL (formerly Jones, Lang LaSalle) and CRBE show the market remains red hot.
For example, JLL's Q3 "
First Look" release, which precedes a more in-depth look at warehouse space markets that will be released in coming weeks, found that year to date, the US market in total has "absorbed" 165.6 million square feet of industrial space, most of it distribution center square footage, while developers have delivered a lower 161 million square feet.
Supply Chain Digest Says... |
|
|
That is a clear sign that "demand continues to outpace supply," JLL says, though there are exceptions to that trend in some markets, such as the Dallas and Chicago areas, where supply has exceeded absorbtion.
Of course, efulfillment is driving a lot of that demand for DC space. JLL says in Q3 25% of demand for distribution centers in the US came from ecommerce companies expanding their DC footprints in markets where they already had a presence. How much of that is from Amazon alone is broken out.
And that demand is not likely to slow, JLL says, as companies in many sectors, such as ecommerce, 3PLs, wholesale distributors and more look to increase logistics productivity through moves to more "modern" buildings.
Naturally, with strong demand comes rising rates. JLL finds that in Q3, warehouse rates were up in 79% of the many markets it tracks. Nationally, lease rates per square foot reached $5.40 per square foot in Q3, up 5.3% and an all-time high, though of course rates in individual markets vary widely, much higher than that figure in some areas, below $5.40 in others.
Nationally, vacancy rates stayed steady at a low 5.2% Q3, though again there are big differences across different markets. Of the 221 square feet of DC space currently under construction, a strong 54.2% has already been leased, up a bit from Q2.
Real estate firm CBRE also weighed in with its early look at the Q3 market data. The headline of the brief report tells the store: "Supply and Demand Imbalance Pushes Rents to Historic Highs."
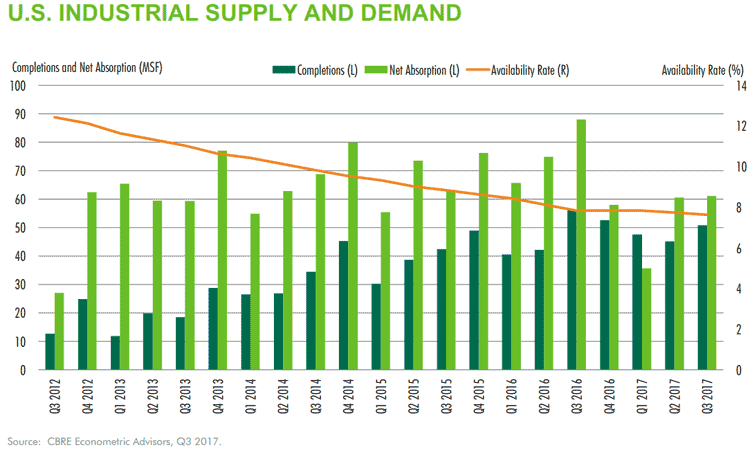
CBRE adds that demand for space exceeded supply for the 28th time in the past 30 quarters, with the industrial market's "availability rate" falling to 7.7%, the lowest level since all the way back in 2001. Net absorption totaled 61.1 million sq. ft. in Q3, marking 30 consecutive quarters of positive demand, which is the longest such streak in more than 20 years.
"After an unusually slow first quarter, demand has bounced back to a level above the cycle average, largely on the strength of ecommerce and omnichannel users," CBRE says.
CBRE adds that new supply of space grew by 12.5% quarter-over-quarter to 50.8 million sq. ft., but was down by 9.3% year-over-year. However, CBRE says lack of available of land sites in many markets has kept construction in check despite record-low vacancy rates, high levels of demand and rapid rent growth.
(See More Below)
|
CATEGORY SPONSOR: SOFTEON |
|
|
| |
|
|
The tight supply pushed net asking rents up by 1.6% for the quarter and 6.3% year-over-year to $6.88 per sq. ft. - the highest mark since CBRE began tracking this metric in 1989. That is obviously above the $5.40 rate reported by JLL, but the definition of the market being tracked probably explains that delta. Both firms agree rates continue to head up.
As shown in the chart below, space absorption has outpace supply additions every quarter but one (Q1 2017) since the start of 2012, driving down availability.

The five markets with the lowest availability are San Francisco area (3.2%), Orange Country, CA (3.8%), Los Angeles (4.2%), surprisingly Detroit (4.3%) and the Central Valley area of California (4.5%). Greatest availability can be found in San Antonio (12.5%), Baltimore (12.0%), Jacksonville (10.8%), Greenville and suburban Maryland (10.7%), and Orlando (10.6%).
So again predictions of a slowdown in the warehouse space market were very premature. It has to reach a short term peak one of these days, but for now space is still hard to find in many markets, and rates keep heading higher.
Are you surprised the market for DC space remains so hot? Are we near a top? Let us know your thoughts at the Feedback section below or the link above to send an email.
Your Comments/Feedback
|