SEARCH searchBY TOPIC
right_division Green SCM Distribution
Bookmark us
sitemap
SCDigest Logo


distribution

Focus: Transportation Management

Feature Article from Our Transportation Management Subject Area - See All
 

From SCDigest's On-Target E-Magazine

- Nov.11, 2015 -


Supply Chain News: US Truckload Carriers Enjoy Generally Strong Q3, Finally Starting to Add Capacity


A Detailed Look at Truckload Segment Results and Trends in Q3


SCDigest Editorial Staff


US truckload carriers decent if somewhat mixed results in Q3, with most citing slowing demand even as they modestly moved to add capacity.

SCDigest Says:

start

Overall profitability stayed about the same, at 6.3% of revenues versus 6.4% in 2014, though again those revenues were impacted by falling fuel surcharges, so the actual profit picture was actually improved over last year.

 
close
What Do You Say?
Click Here to Send Us Your Comments
feedback
Click Here to See Reader Feedback


We're back as usual with our quarterly review of the results and trends across freight modes.

This week, we cover the US truckload sector and then follow in the next two weeks with reviews of first the rail and then the LTL carriers after that.

In looking at the truckload market overall in Q3, rates were up fairly strongly, though well down from earlier in the year. The Cass Linehaul Index, which measures per mile truckload rates before accessorials, was up 3.6%, 3.7% and 3.2% in July, August and September, respectively, versus 2014 levels.

That compares with rate gains of more than 5% in each of the first three months of 2015.

Average revenues per total mile net of fuel surcharge, a proxy for rate changes, increased 2.8% at Werner in Q3 compared to the same period in 2014.  JB Hunt did even better, saying rates in its truckload unit were up 4.5% year over year Q3. Knight said its revenue per loaded mile was up 4.6% in the quarter.

The freight analysts at Avondale Partners, who work with Cass on the Index, recently lowered their predictions for full year rate gains of 3.5% to 5.5%, several percentage points down from earlier in the year, noting that several factors have together contributed to an increase in overall capacity.

These 3-4.5% increase in rates in Q3 were realized by almost every one of those public carriers we follow even though virtually all of them used adjectives such as "tepid" or "lukewarm," to describe the freight market in the quarter. Werner, for example, noted that "freight demand in Q3 and through October has been similar to historical standards and not as strong as the robust freight market during the same periods in 2014."


As another data point, the American Trucking Associations' seasonally adjusted Freight Tonnage Index was up 3.3% year to date through September.

"The see-saw pattern in truck freight tonnage continued again in September, except that the gain didn't fully wipe out August's decline" said ATA Chief Economist Bob Costello. "However, over the last few months tonnage has snapped back from softness this past spring and early summer, and is approaching the record high."


But despite some recent softness, the carriers are starting to add back some capacity, even in the face of the continued driver shortage which constrains fleet growth. JB Hunt's truckload unit, for example, which lowered its tractor count for quarter after quarter in recent years, ended Q3 with 2,100 tractors compared to 1,843 a year ago.


Swift said its average operational truck count across all segments increased by 831, or 4.8%, year over year in the third quarter, including a 517 increase from the beginning of 2015 through September 30, 2015.


So, after years of fleet discipline that saw limited fleet growth, the trend seems to heading modestly the other way. That said, Werner noted that "Truckload industry capacity is challenged by an extremely competitive driver recruiting market and heightened regulatory cost increases for safety and truck ownership. We expect this favorable trend [for carriers] will continue."


Carrier revenues for the quarter and year to date have been impacted heavily by the reduction in fuel surcharge revenues stemming from the big drop in diesel prices. That of course doesn't really impact the underlying carrier financials, as the fuel surcharge is largely just a cost pass through, although with some lag such that it can impact results in a given quarter.


One noticeable change is that the rapid growth in intermodal clearly slowed at many carriers in Q3. JB Hunt's intermodal unit, which saw near double digit growth for many years, saw volume growth of just 3% in Q3. Swift saw intermodal growth of just 1% in the quarter, amidst evidence low diesel prices were causing some freight to move from rail to truck in recent months.


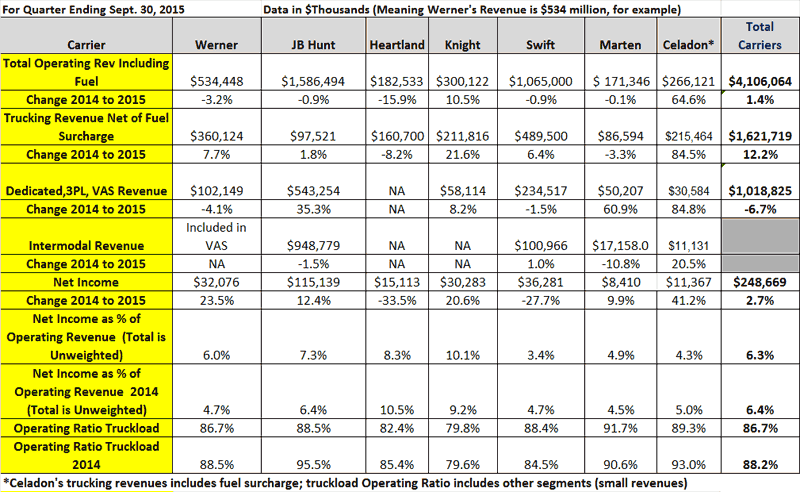
Profits across all seven truckload carriers we follow were up a modest 2.7% for the quarter, though as shown in the chart below, that overall number masks some large swings across individual carriers. Profits were up more than 23% at Werner, for example, but down 33% at Heartland Express.


Overall profitability stayed about the same, at 6.3% of revenues versus 6.4% in 2014, though again those revenues were impacted by falling fuel surcharges, so the actual profit picture was actually improved over last year.


That was reflected in improved average operating ratios, or operating expense divided by operating revenue, a key transport sector metric. Our unweighted average across all seven carriers fell to 86.7%, versus 88.2% in 2014.


The full Q3 results for all seven carriers is provided in the table below.


Truckload Results Q3 2015


Source: SCDigest


Click here to View Larger Image


(Transportation Management Article Continued Below)

 
CATEGORY SPONSOR: SOFTEON


As usual, we end with some selected comments from each carrier's earnings reports, starting with Werner, which as is generally the case provided by far the most extensive commentary.


Werner

Werner said that freight demand in Q3 and through October has been similar to historical standards and not as strong as the robust freight market during the same periods in 2014.

It added that "Truckload industry capacity is challenged by an extremely competitive driver recruiting market and heightened regulatory cost increases for safety and truck ownership. We expect this favorable trend will continue."

It cited other factors that could negatively impact industry capacity, including mandatory electronic logging devices (ELDs), a national drug and alcohol driver database, increased minimum liability insurance requirements for carriers, more sophisticated drug screening procedures for drivers and mandatory truck speed limiter devices.

Average revenues per total mile net of fuel surcharge, a proxy for rate changes, increased 2.8% in third quarter 2015 compared to 2014.

We are making continued progress implementing sustainable rate increases with our customers. These efforts are ongoing as we move forward and work to recoup the cost increases associated with more expensive equipment, a shrinking supply of qualified drivers and an increasingly challenging regulatory environment.

Werner ended Q3 with 7,415 trucks in its truckload segment, a sequential improvement of 140 trucks compared to Q2 2015 and a year-over-year improvement of 355 trucks compared to the end of third quarter 2014.

JB Hunt

Hunt said that "Customer rate increases, load growth of 3% in Intermodal, a 6% increase in revenue producing trucks and improved asset productivity in Dedicated Contract Services, a 9% increase in load volume in Integrated Capacity Solutions, and 14% increase in truck count in our Truck business segment could not offset the decrease in fuel surcharge revenue."

Cited "tepid customer demand" in the quarter.

The growth continues to slow in intermodal. Overall volumes increased just 3% over the same period in 2014. Hunt's Eastern network load growth slowed to 1% and transcontinental loads grew 4% over the third quarter 2014. Still, revenue per load excluding fuel surcharges increased approximately 5% compared to third quarter 2014.

In truckload, revenue excluding fuel surcharge increased 10%, primarily from increased truck count and core rate increases of approximately 4.5%. At the end of the period, the trucking segment operated 2,100 tractors compared to 1,843 a year ago.

Heartland

Noted that impacting the quarter were lower than anticipated freight volumes compared to the first and second quarter of 2015.

Heartland noted that "While driver attrition has slowed, since implementation of our updated pay package in late 2014 and early 2015, attracting and retaining professional drivers that meet our high standards of safety continues to be an ongoing challenge."

The average age of the company's tractor fleet was 1.6 years as of September 30, compared to 2.1 years at September 30, 2014.

Knight

Company cited a "lukewarm freight environment" in Q3.

Saw revenue per loaded mile, a reasonable proxy for rates, up 4.6% in the quarter.

Noted that "The current shortage of qualified driving associates has been and will continue to be a headwind for adding additional capacity. Our driver development and training programs remain a primary focus area for our management team."

Swift

Swift said its average operational truck count across all segments increased 831 trucks, or 4.8%, year over year in the third quarter, including a 517 increase from the beginning of 2015 through September 30, 2015.

Truckload revenue net of fuel surcharge increased 6.4%, driven by a 3.6% increase in revenue per loaded mile.

Swift's dedicated revenue net of fuel surcharge grew 8.9%., and it said weekly revenue per tractor improved 5.7% year over year," due to improved customer pricing."

Its adjusted Operating Ratio for the third quarter of 2015 was up, to 99.2%, primarily due to driver wage increases.

However, Swift noted that "The direct feedback we receive through our weekly driver surveys validates the importance and our continued focus on these driver-orientated initiatives, and reiterates our belief that Swift is increasingly becoming the employer of choice among driving professionals within the industry."

Marten

Operating revenue, net of fuel surcharges, improved 10.0% to $154.0 million for the third quarter of 2015 from $139.9 million for the third quarter of 2014, and improved 8.8% to $438.6 million for the first nine months of 2015 from $403.2 million for the first nine months of 2014.

Marten said it has increased its truckload and dedicated tractor count by 276 tractors, or 11.9%, since December 31, 2014.

Brokerage revenue increased by 21.3% in the quarter.

Celadon

Average seated line-haul tractors grew, mostly through acquisition, to 4,985 in Q3 from 3,255

The average age of the company's tractor fleet was just 1.2 years as of September 2015.


Any reaction to our Q3 2015 truckload segment review? Let us know your thoughts at the Feedback button (for email) or section (for web form) below.


Recent Feedback


No Feedback on this article yet


.