The reality of supply chain project ROI is that it is best represented as a probability curve, not as a single number (e.g., expected internal rate of return), as though the single number approach is by far the most commonly used method to calculate and evaluate ROI within the industry.
SCDigest Editor Dan Gilmore's First Thoughts column on this topic argued why probability is inherently a better and more accurate approach (even at the “price” of more complexity). It will often ultimately lead to better investment decisions, both in terms if “go/no go” and how to maximize total expected return by factoring in risk. (See The "Probability of Supply Chain ROI.)
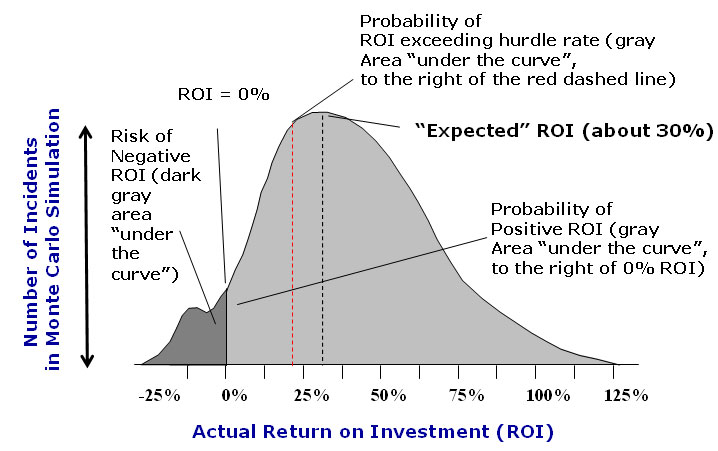
This concept is illustrated in the graphic below. It takes some mental exercise to grasp the concept at first, but with that effort the idea should be clear in the end.
The approach starts in part by estimating the probability of savings or ROI in a number of different aspects of a project (e.g., what is the level of confidence we have that we will achieve this rate of inventory reduction?). Different components of savings and ROI a "Monte Carlo" simulation is run using something as simple as Excel to generate a range of ROI results based on those probabilities.
The result can be something like what is shown in the graphic. The X-axis represents different potential project ROI levels, ranging from negative returns to as much as 125% (this is just a specific example – the real results range would be specific to a given project).
The "expected" ROI is the ROI that occurs the most times in the simulation - or the top of the curve. Logically, returns slightly above or below that number are also seen a high number of times.
The probability of different scenarios can be determined by the “area under the curve for a given range of ROI (easily calculated). The total area under the entire curve would represent 100%. So, in this example, the probability that the project will have at least a positive ROI (the area under the curve to the right of 0%) might be something like 90%.
The probability that the ROI will exceed the corporate hurdle rate (everything to the tight of the red dashed line) might be about 70%.
ROI as Probability Curve
Source: Doug Hubbard, Hubbard Decision Research
This data could also be represented this way as well:
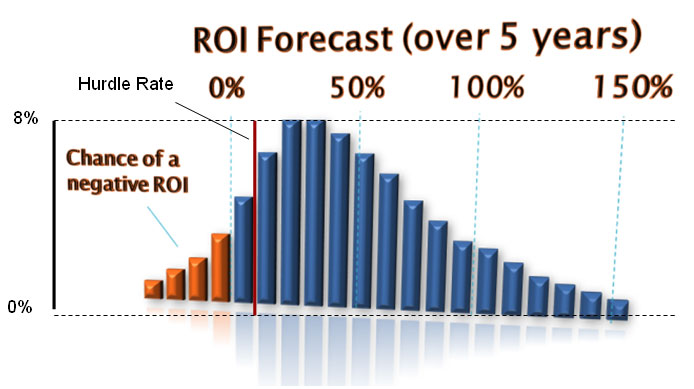
In this view, the potential ROI is divided into 20 ranges (e.g. 10-15%). The height of each range bar indicates its probability of occurrence, with the top probability being achieved by the two ranges that each top out at about 8%. So, if you added up the probability of each range to the right of the red line, it would total the probability that the project will exceed the corporate hurdle rate.
This kind of analytic power is very valuable.
Agree or
disagree? What is your perspective? Let
us know your thoughts at the Feedback button
below.
|


