Supply Chain Trends and Issues: Our Weekly Feature Article on Important Trends and Developments in Supply Chain Strategy, Research, Best Practices, Technology and Other Supply Chain and Logistics Issues  
 
 
  - Jan. 11, 2012  

Supply Chain News: The Supply Chain Year in Numbers and Graphs


From Factory Utilization to Oil Prices, we Chart the Year in Supply Chain


  by SCDigest Editorial Staff  


It was a another roller coaster year for the supply chain, which as always is tied at the hip to trends and changes in the broader economy.

In this article, we look at some of the key numbers in the economy and the supply chain for 2011, providing a series of charts to illustrate the data.

The Economy

It was a year of disappointment and uncertainty for most of the year, though it ended on what were viewed as some positive vibes.

US economic growth was weak, with GDP coming in a just .4%, 1.4% and 1.8% percent for the first three quarters of the year, well below the levels of growth achieve in 2010. However, remember that the 2009 numbers were terrible, making the 2010 comparisons off the lows relatively easy. See the graphic below.

Still the weak Q1 growth and skyrocketing commodity prices towards the end Spring led to real fears of a double dip recession for much of the second and third quarters, but each tome sime modestly good economic news would stave off those worries.


Much of the occasional good news came from the US manufacturing sector. The Institute for Supply Management's Purchasing Managers Index remained above the 50 mark that separates expansion from contraction all year, and was especially strong in the first four months of 2011, when it soared above 60. After coming down from there, almost falling below 50 a couple of times, the PMI came back strong in December with its highest reading since June.


It seemed the economy kept trying to come back, but was thwarted in late summer by a US credit downgrade and a stalled debt deal in Washington, and most of the year, especially in the second half, over non-stop worries related to the debt crisis among countries and banks in Europe.


(Supply Chain Trends and Issues Article - Continued Below)


CATEGORY SPONSOR: LONGBOW ADVANTAGE - JDA SUPPLY CHAIN CONSULTANTS

Download Longbow Advantage

Business Briefs


The Keys to WMS Success,

Maximizing JDA WMS

Performance and More


Unemployment remained over 9% until the very end of the year. Companies also continued to hoard dollars, with strong profits due to aggressive cost cutting combined with a decent economy spinning off a lot cash, but corporations weren't spending much of it. Cash holdings in the 1000 largest companies were up 11% in Q2 versus the prior, the last period for which data is available - and that was after record cash levels in 2010. We will note, however, that despite that, spending on supply chain software was strong during most of the year.

Select Supply Chain Numbers

Consistent with numbers showing general strength in manufacturing, US capacity utilization continued to rise, though more slowly than in 2010.

As shown in the chart below, after a rapid rise in 2010, factory utilization started the year at 76.9%, and ended November (last month available) up about a point, at 77.8%. That versus the 40-year average of about 80.4%. Growth in capacity utilization drives employment growth and gives manufacturers more pricing power. This metric bottomed at a modern day record low of about 65% in June 2009.


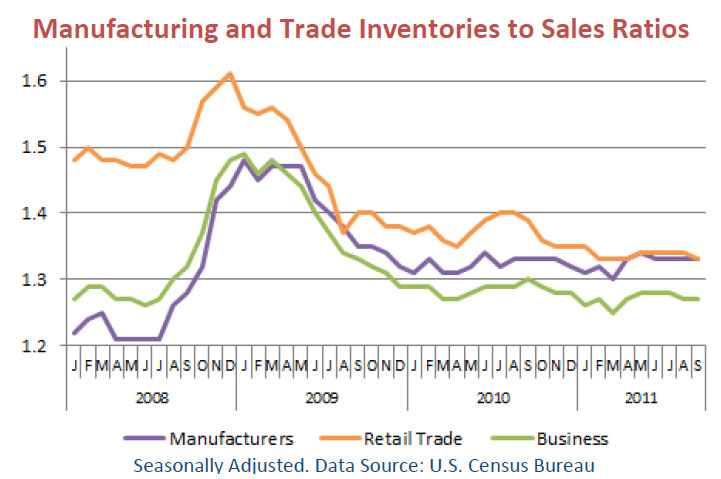
After some wild swings over the previous two years, the Inventory-to-Sales ratio remained basically flat in 2011, near record lows, as companies continue to focus heavily on inventory management.


Inventory levels had risen sharply in late 2008 into 2009, as the rapid collapse of demand caught companies short, then came down steeply for the rest of 2009 as companies pared inventories heavily. The metric has been pretty steady this then, falling very gently towards the end of 2011, down a bit from 2010 but mostly flat on the year.

Overall business inventories (green line) have settled just a tad above levels seen in 2008, but those represented record lows, as not surprisingly the overall trend continued to be lower inventory levels.


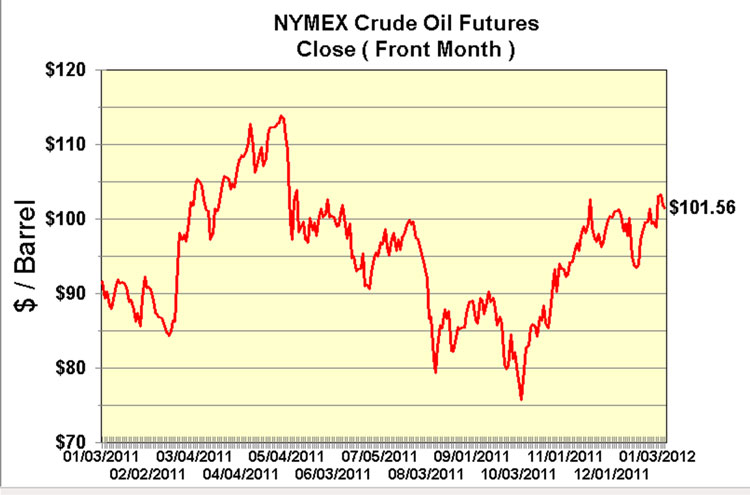
Oil prices as usual now it seems had a dynamic year, but ended the year up strongly. The chart below shows 2011 prices for West Texas Intermediate (WTI), which started the year at about $92.00 per barrel, spiked to as high as almost $115.00 in May, and ended it at about $101.00 - a 10% increase from the end of 2010. Brent Crude was up even more, rising about 13% during 2011, as the once greatly feared level of $100.00 per barrel has simply become commonplace.


Continue to Page 2 of this Article


SCDigest is Twittering!

Follow us now at https://twitter.com/scdigest

 
Send an Email


.