Cliff Holste, Materials Handling Editor Cliff Holste, Materials Handling Editor
| |
SCDigest Says: |
| |
 The list of the top 10 metrics used is surprisingly dynamic, in our view, and whether that is the reality or more reflective of a changing respondent base from year to year is unclear.. The list of the top 10 metrics used is surprisingly dynamic, in our view, and whether that is the reality or more reflective of a changing respondent base from year to year is unclear..

Click Here to See Reader Feedback
|
As usual, the 2010 DC Metrics report was released last week at the annual Warehouse Education and Research Council conference in Anaheim, CA (See
Warehouse Education and Research Council (WERC) 2010 Day 1 and 2 Video Review.)
The respondents were roughly broken into thirds between companies over $1 billion in sales (31.9%), those between $100 million and $1 billion (30%), and those under $100 million (38.15).
That is probably a larger proportion of smaller companies than most supply chain surveys, and certainly has an impact on the subsequent numbers. The published version of the report does not really break out the analysis by company size, though in another annual study done by Manrodt he has observed that supply chain performance is generally better the larger a company is.
Manrodt and Vitasek say that one trend in this year's data is that companies tended to move more towards internal measures, versus those focused on customers.
"There is a continued shift from taking a balanced approach to measures to focusing on the internal operations of the warehouse, first noticed last year," they note in the WERCWarch report available to conference attendees and soon on the WERC website. "Firms may feel the need to cut costs and become more efficient in the short term. However, losing site of the customer could cause reductions in loyalty or satisfaction."
Second, as with many other recent studies, this one shows a growing gap between best-in-class peformers and laggards, the authors say.
"Best in class performers did not attain this status serendipitously. They do not simply use benchmarking data to set targets," Manrodt and Vitasek say. "They tend to look behind the numbers to understand how their level of performance was reached by identifying the unique processes, tools, and methods required to achieve best-in-class performance."
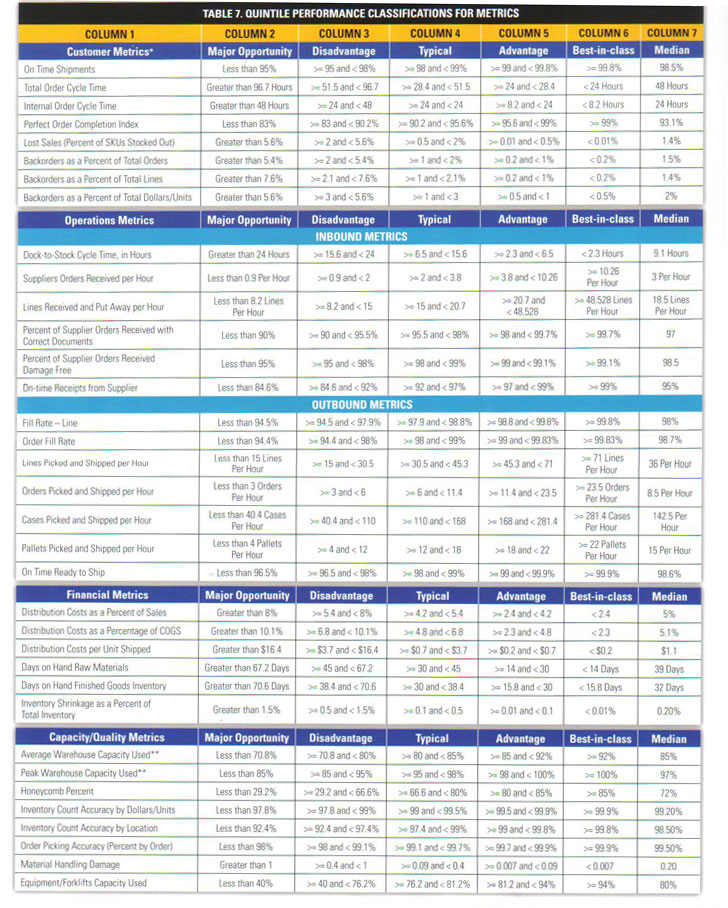
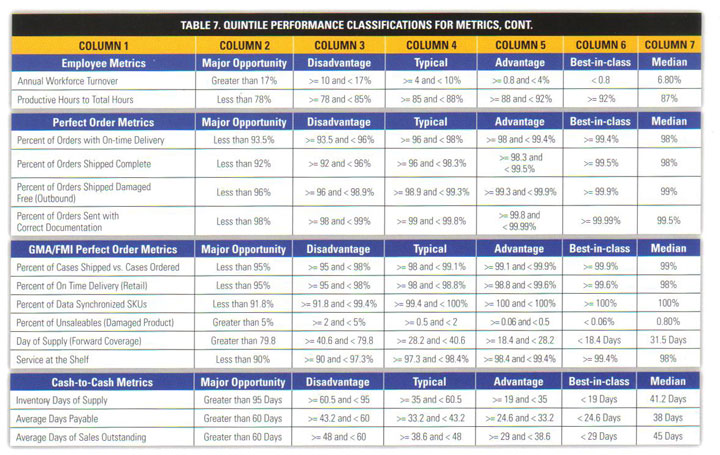
What are the Top DC Metrics?
Each year, the study develops a list of the top 10 DC metrics, based on the percent of respondents using a given metric to measure performance.
The list is surprisingly dynamic, in our view, and whether that is the reality or more reflective of a changing respondent base from year to year is unclear.
(Distribution Article - Continued Below)
|