There is a general consensus among supply chain pundits that commodity and other input costs are more dynamic than ever.
Is that true?
We're not sure, although it is clear that the overall direction has largely been up for quite some time, despite a general commodity price slump since Q2 2011.
The graphic below shows changes in the widely followed Reuters CRB commodity index since October 2007. That index is based on a basket of commodities across energy, agriculture, metals, industrial commodities and more. The chart is from Reuters CRB data, with annotations on the graph from SCDigest.
Reuters CRB Commodity Index Oct. 2007 to Oct. 2012
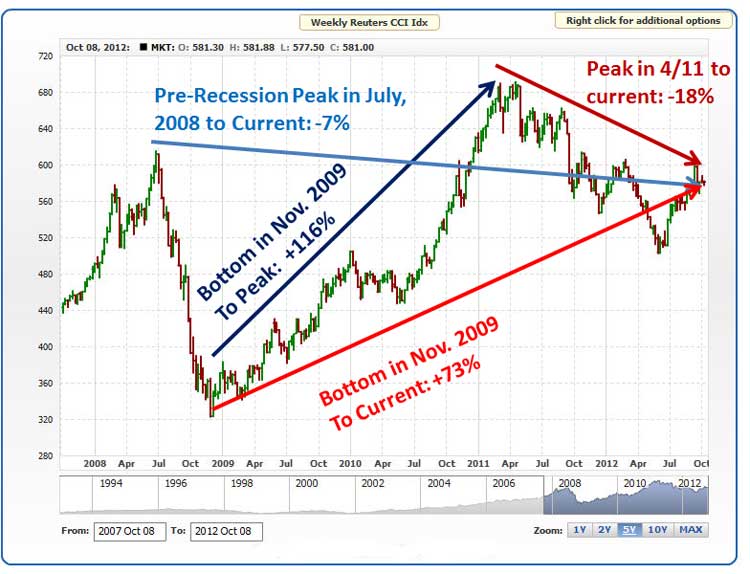
We think this graphic shows a very interesting tale.
Commodity prices right now are up about 73% from the bottom in November, 2009.
That even though prices on average across the basket are down about 18% from the recent peak in April 2011.
From the pre-recession peak in July, 2008, prices currently are actually down about 7%.
From the bottom in 2009, prices were up an incredible 116% to the peak in April 2011.
Not shown in the annotations, but prices are down about 2% so far in 2012, but up about 12% since this year's bottom to date in early June.
Commodity prices have been held in check recently by general global economic weakness, especially in Europe, China and India, and a generally strong US dollar, the global currency for most commodities. But in Q3, the drought in the US sent many food commodities soaring, and oil prices also spiked. Most metal prices (with the exception of iron ore) also rose sharply, all leading to the rise in the Reuters index.
We're not sure about short-term volatility, but we say the evidence does say the despite occasional hiccups, the overall trend in input prices is up, and likely to continue in that direction.
Any Feedback on our Supply Chain Graphic of the Week? Let us know your thoughts at the Feedback button below.
|


